

Workplaces are far safer now than they were even a few decades ago. Still, the Bureau of Labor Statistics says there are 3.1 workers comp claims filed for every 100 full-time employees.
Know the stats behind workers comp claims to identify trends, make informed decisions, and add more value to your clients. To help, we compiled the latest numbers from key sources in safety and insurance to empower you to better help your clients.
Workplace Injury & Death Statistics
Too often, insurers associate high-risk industries with high rates of injury. The logic behind the sentiment makes sense, but when you dive into the numbers, the story isn’t so simple.
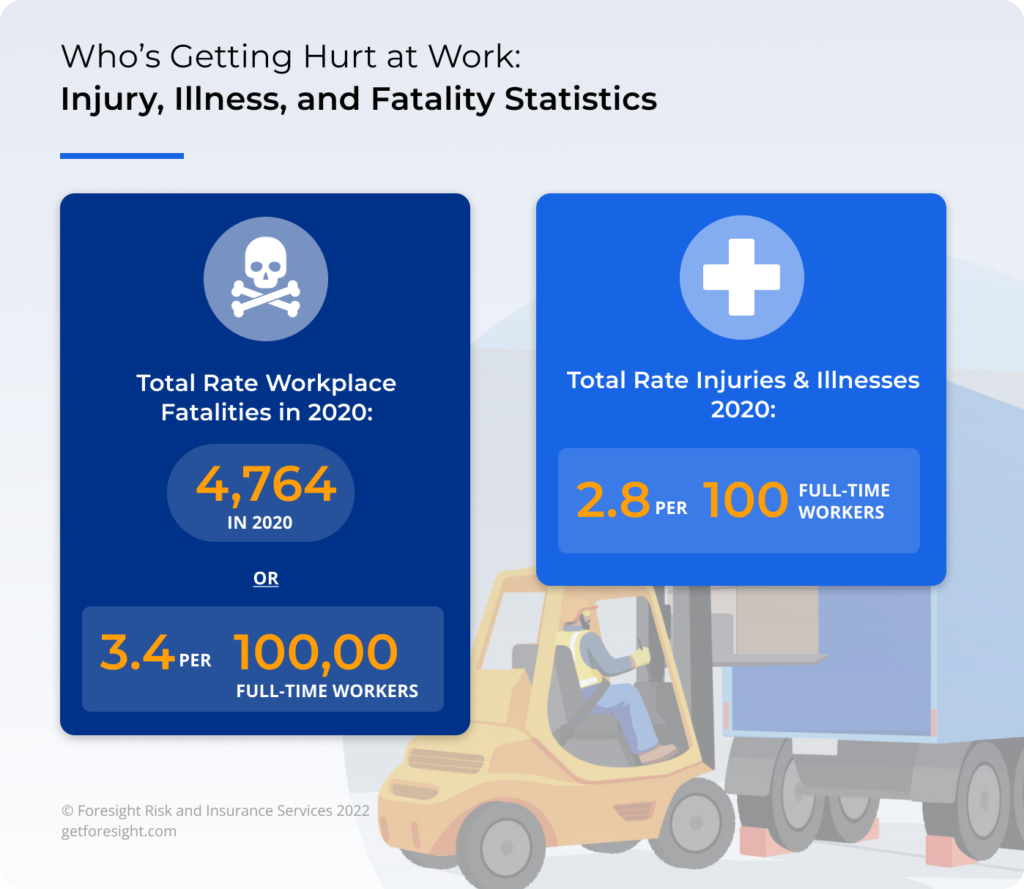
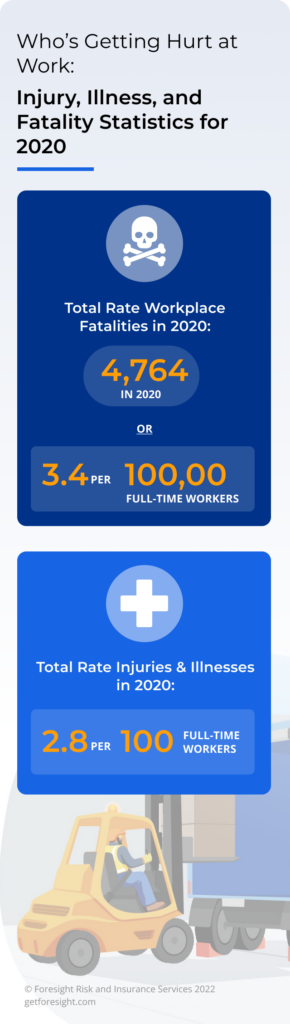
- Total Rate Workplace Fatalities in 2020: 4,764 or 3.4 per 100,000 full-time workers
- Total Rate Injuries and Illnesses in 2020: 2.8 per 100 full-time workers
Workplace Fatality Trends
The latest data from the Department of Labor indicates the positive trend of fewer workplace fatalities is continuing. The total number of fatal occupational injuries in 2020 was the lowest annual number since 2013.
2020 saw a decrease in the number of workplace fatalities year-over-year from 2019. 4,764 worker fatalities were recorded. It’s a 10.7% decrease from 2019 when 5,333 workers died as a result of a workplace incident. The fatalities per 100,000 full-time equivalent (FTE) workers also dropped to 3.4 per 100,000 FTE in 2020, compared to 3.5 per 100,000 FTE in 2019.
While average daily deaths dropped to 13 per day in 2020, down from 17 in 2018, there were also more absences across all industries due to the Covid-19 pandemic.
It’s unlikely we’ll ever see zero. At the same time, everyone can do more to work toward zero deaths.
One of the ways we can do that is by understanding where and why workers are dying as a result of their workplace injuries and illnesses. To determine this, you need to look beyond the numbers and consider the measurements used.
Most Dangerous Jobs: Workplace Deaths by Occupation
Construction remains one of the most dangerous industries, ranking second behind transportation and warehousing for the most total number of job-related deaths. According to the National Safety Council, construction has reported the most number of deaths since 2012.
COVID-19 played a key role in the numbers :
- Education and services moved up from 7th to 1st in nonfatal injuries
- Contact with equipment or objects was the second leading cause of injury to agriculture, forestry, fishing, and hunting workers
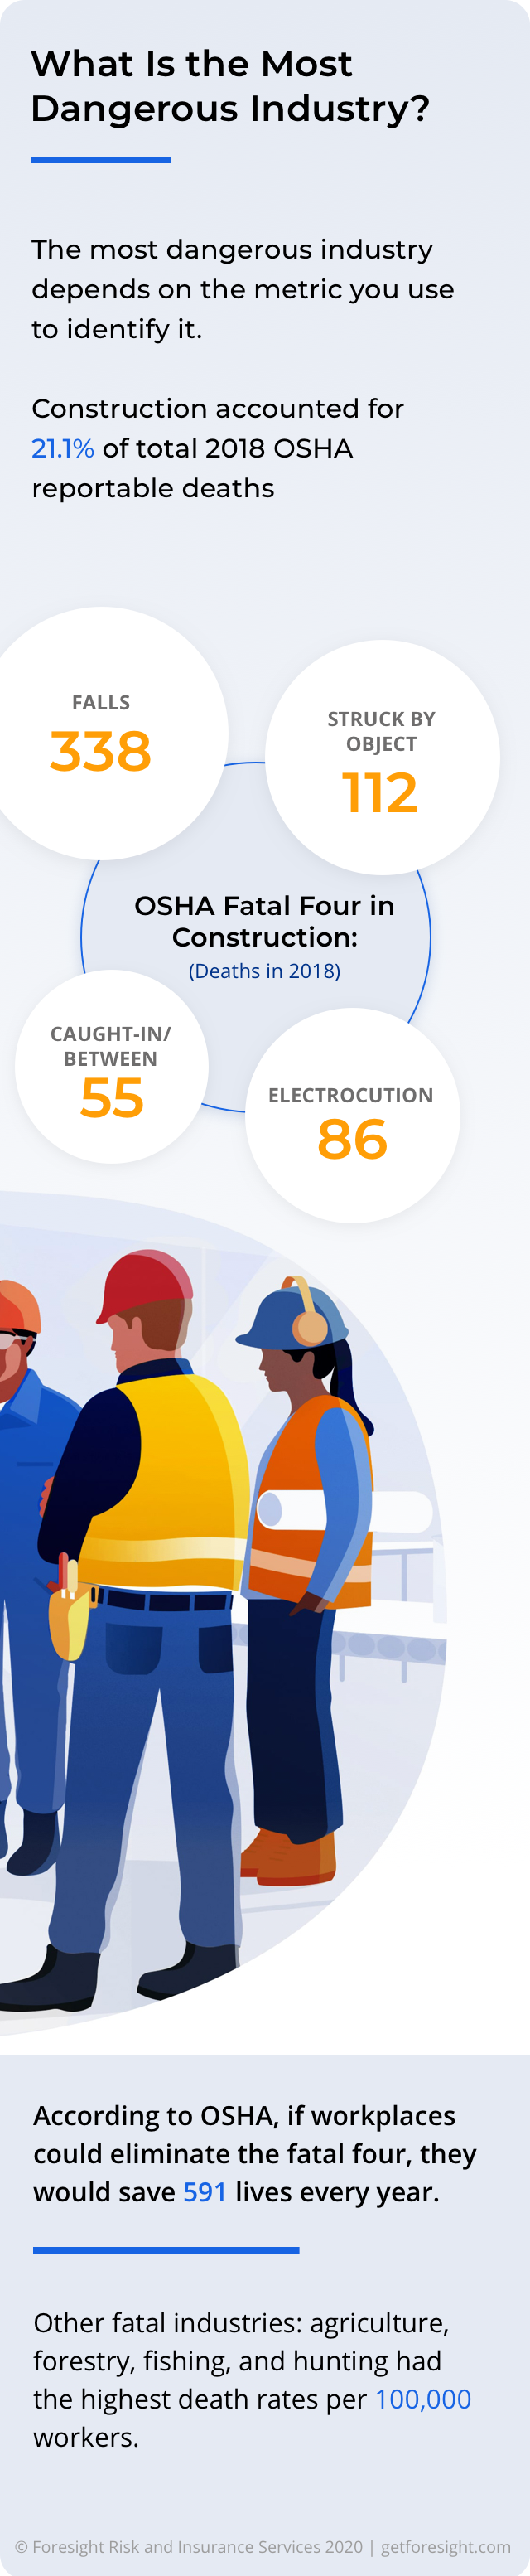
Key takeaway: The “most dangerous industry” depends on the metric you use to identify it.
What’s the Most Common Cause of Workplace Fatalities?
Recently released data from the 2020 BLS National Census of Fatal Occupational Injuries tell an interesting story of which types of injuries are occurring on the job site. And while some of the trends have remained consistent with previous years, there are interesting data points that are new. Here are the top causes of fatalities in 2020:
- All transportation (includes vehicle crashes) – 37.3% (transportation incidents were down 16.2% from 2019)
- Falls – 17% of total
- Contact with objects and equipment – 15%
- Assaults and violence (including homicide) – 15%
- Exposure to harmful substances or environments – 14%
- Fires and explosions – 1.4%
Source: U.S. Department of Labor, Bureau of Labor Statistics, Census of Fatal Occupational Injuries

The BLS produced similar data for construction workers. It identifies the “Fatal Four” construction accidents, which accounted for 58.6% of all construction worker deaths in 2018. The Fatal Four include:
- Falls (338 construction deaths in 2018)
- Struck by an object (112 construction deaths in 2018)
- Electrocution (86 construction deaths in 2018)
- Caught-in/between (55 construction deaths in 2018)
According to OSHA, if workplaces could eliminate the fatal four, they would save 591 lives every year.

What Are the Industries with Highest Injury Rates?
AIn 2020, private industry reported a decrease in the number of nonfatal workplace injuries and illnesses; 2.7 million compared to 2.8 million in 2019.
Again, COVID-19 causes an interesting wrinkle in the data. Private companies reported 1.1 million nonfatal injuries and illnesses that resulted in at least one day of work missed. That’s up 32.4% over 2019. And of those reported, 33.2% were related to diseases due to viruses not elsewhere classified, which includes COVID-19.
Landscaping is not on the list of nonfatal work injuries, but a troubling trend indicates that workplace incidents need to be addressed in this industry. According to the CDC, landscaping higher than average fatal and non-fatal injuries.
The number of serious injuries has increased from 16% to 21% between 2001 and 2017. 22% of serious claims were related to loading trucks and trailers.
Arborists and tree-related injuries made up 34% of the top 100 most expensive claims in this industry.
So what’s driving the increase in numbers? The data points to a lack of training and younger workers being more susceptible to injury. Young workers (34 years old or younger) made up 50% of serious injuries. Another 46% to 55% of injuries occurred in the first year on the job. There’s a significant gap in training and preparation during the early years of a workers’ career.
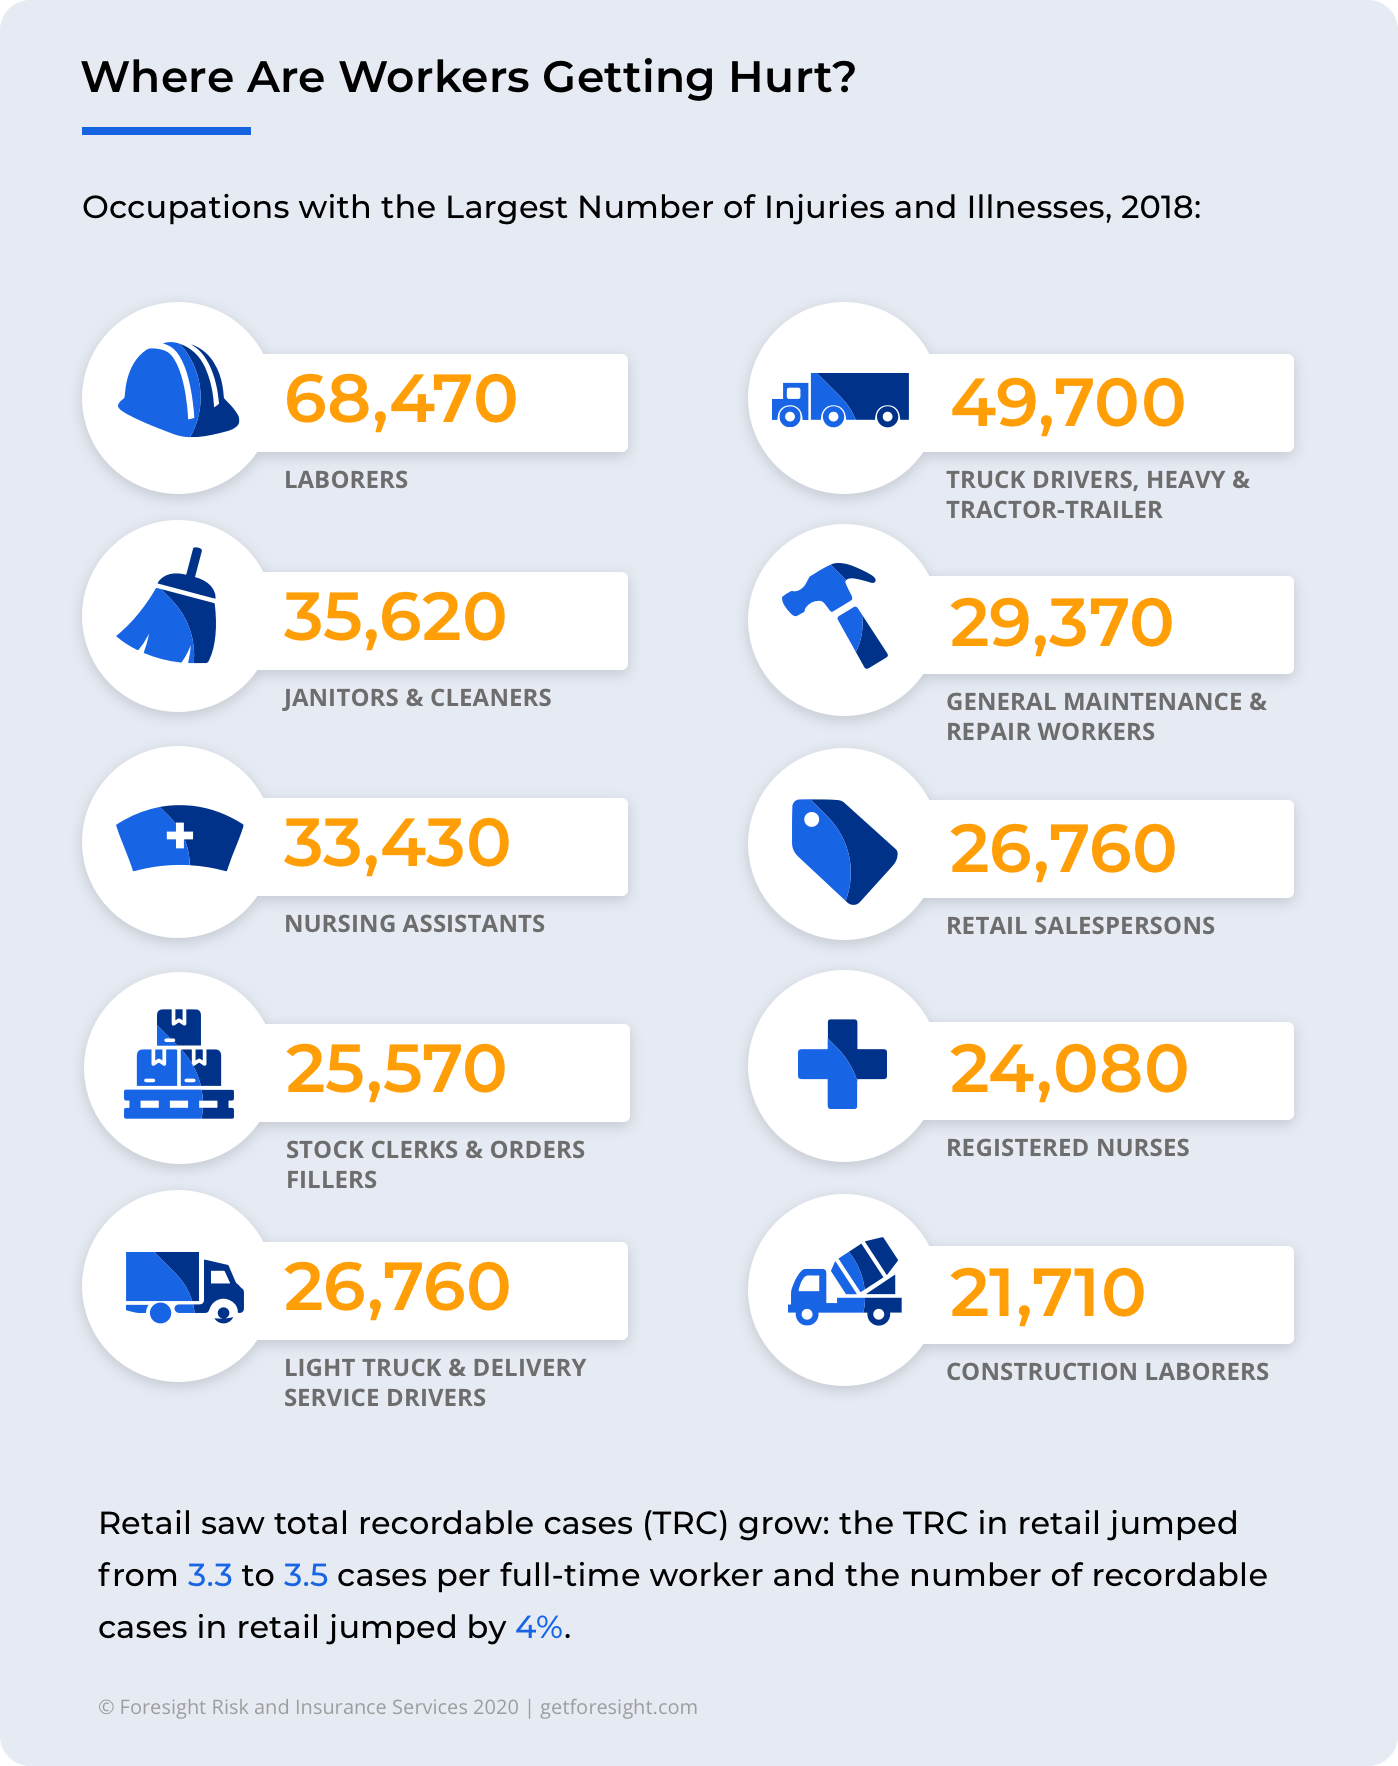
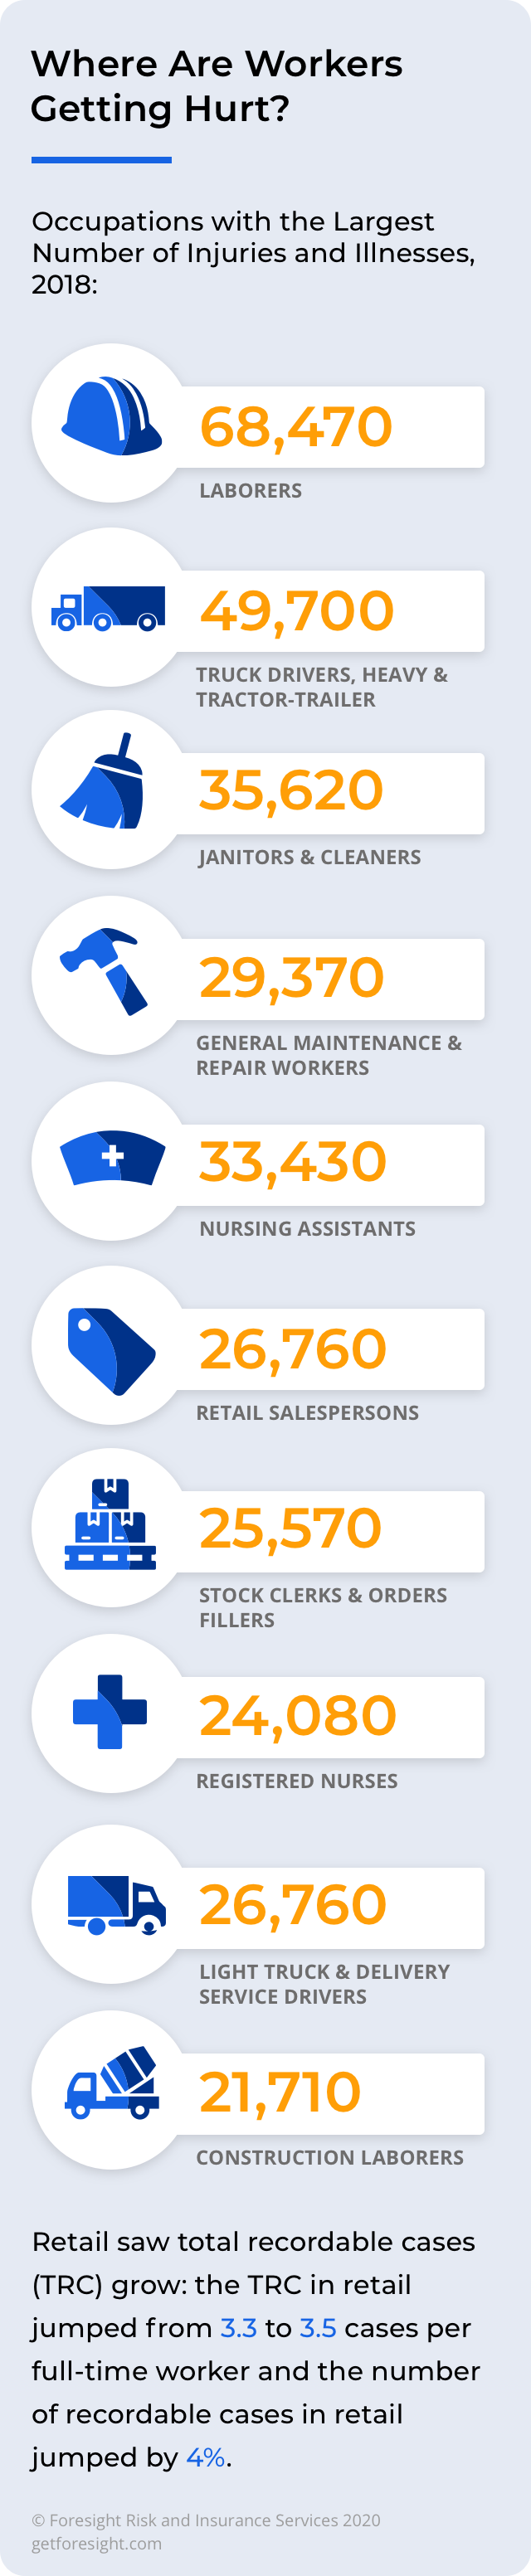
Healthcare workers jumped to the top of the list of nonfatal injuries resulting in days away from work. The pandemic placed an enormous amount of strain on the US healthcare system, leading to more nonfatal injuries for frontline medical workers. Here’s the full list:
- Nursing assistants
- Licensed practical and licensed vocational nurses
- Registered nurses
- Laborers and freight, stock, and material movers
- Heavy and tractor-trailer truck drivers
- Maintenance and repair workers, general
- Stock and order fillers
- Retail salesperson
What Are the Most Common Workplace Injuries According to OSHA?
The rate of workplace injuries is holding steady, except in unique cases like retail. But what injuries are occurring, and why are they happening? To answer the question, we turned to the 2018 BLS report (with contributions from the U.S. Department of Labor, Survey of Occupational Injuries and Illnesses, and participating state agencies).
Incidence Rates per 10,000 full-time workers:
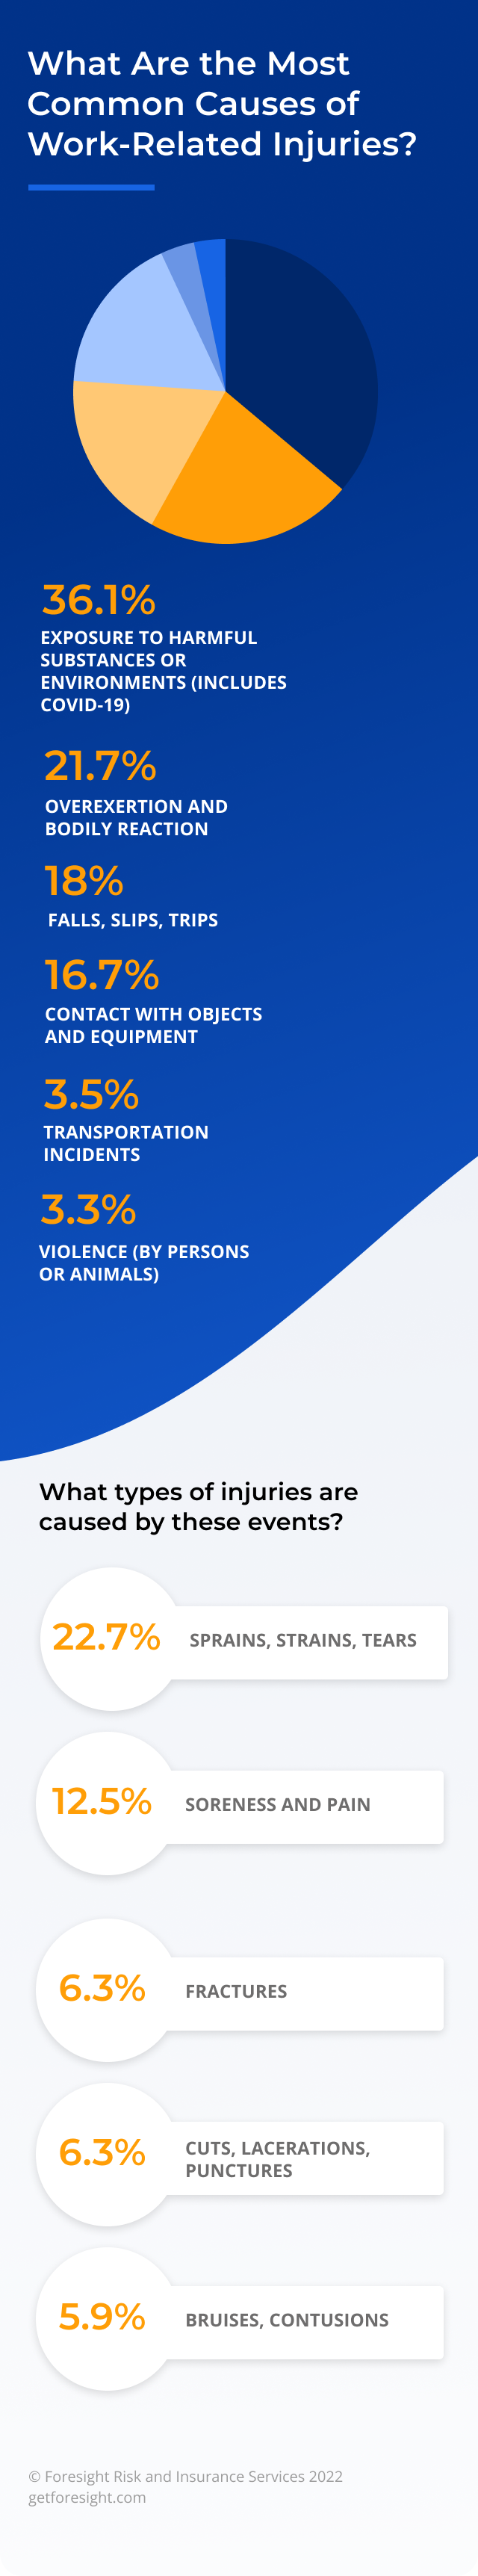
- Sprains, strains, tears: 30.7
- Soreness or pain – 15.9
- Cuts, lacerations, punctures – 9.2
- Bruises, contusions – 7.9
- Fractures – 7.9
The data tells us that soft tissue injuries dominate most workplace injuries. However, the incidence rates above don’t reflect what’s happening in retail, where injuries are increasing across the board.
The Incidence Rates per 10,000 full-time workers in retail for the same injuries are:
- Sprains, strains, tears – 38.4
- Soreness, pain – 16.1
- Bruises, contusions – 14.1
- Cuts, lacerations, and punctures – 12.0
- Fractures – 8.4
What Are the Most Common Causes of Work-Related Injuries?
According to data from the National Safety Council (NSC):
- Exposure to harmful substances or environments (includes COVID-19)-36.1%
- Overexertion and bodily reaction – 21.7%
- Falls, slips, trips – 17%
- Contact with objects and equipment – 16.7%
- Transportation incidents – 3.5%
- Violence (by persons or animals) – 3.3%
Recordable COVID-19 infections may also find a place on this list by the new year.
Workplace Injury Demographics
The same BThe 2020 Census reported alarming numbers for Hispanic or Latino workers. The number of fatal injuries for this population increased from 20.4% in 2019 to 22.5% in 2020. 1,072 Hispanic or Latino workers were fatally injured in 2020.
The fatality rate for Hispanic or Latino workers per 100,000 FTE employees also increased in 2020 to 4.5, up from 4.2 in 2019.
Hispanic or Latino workers make up the third largest race or ethinc group experiencing fatal work injuries. While most ethinic groups are experiencing a downward or flat trend of workplace fatalities, Hispanics or Latinos have seen their numbers increase dramatically since 2016.
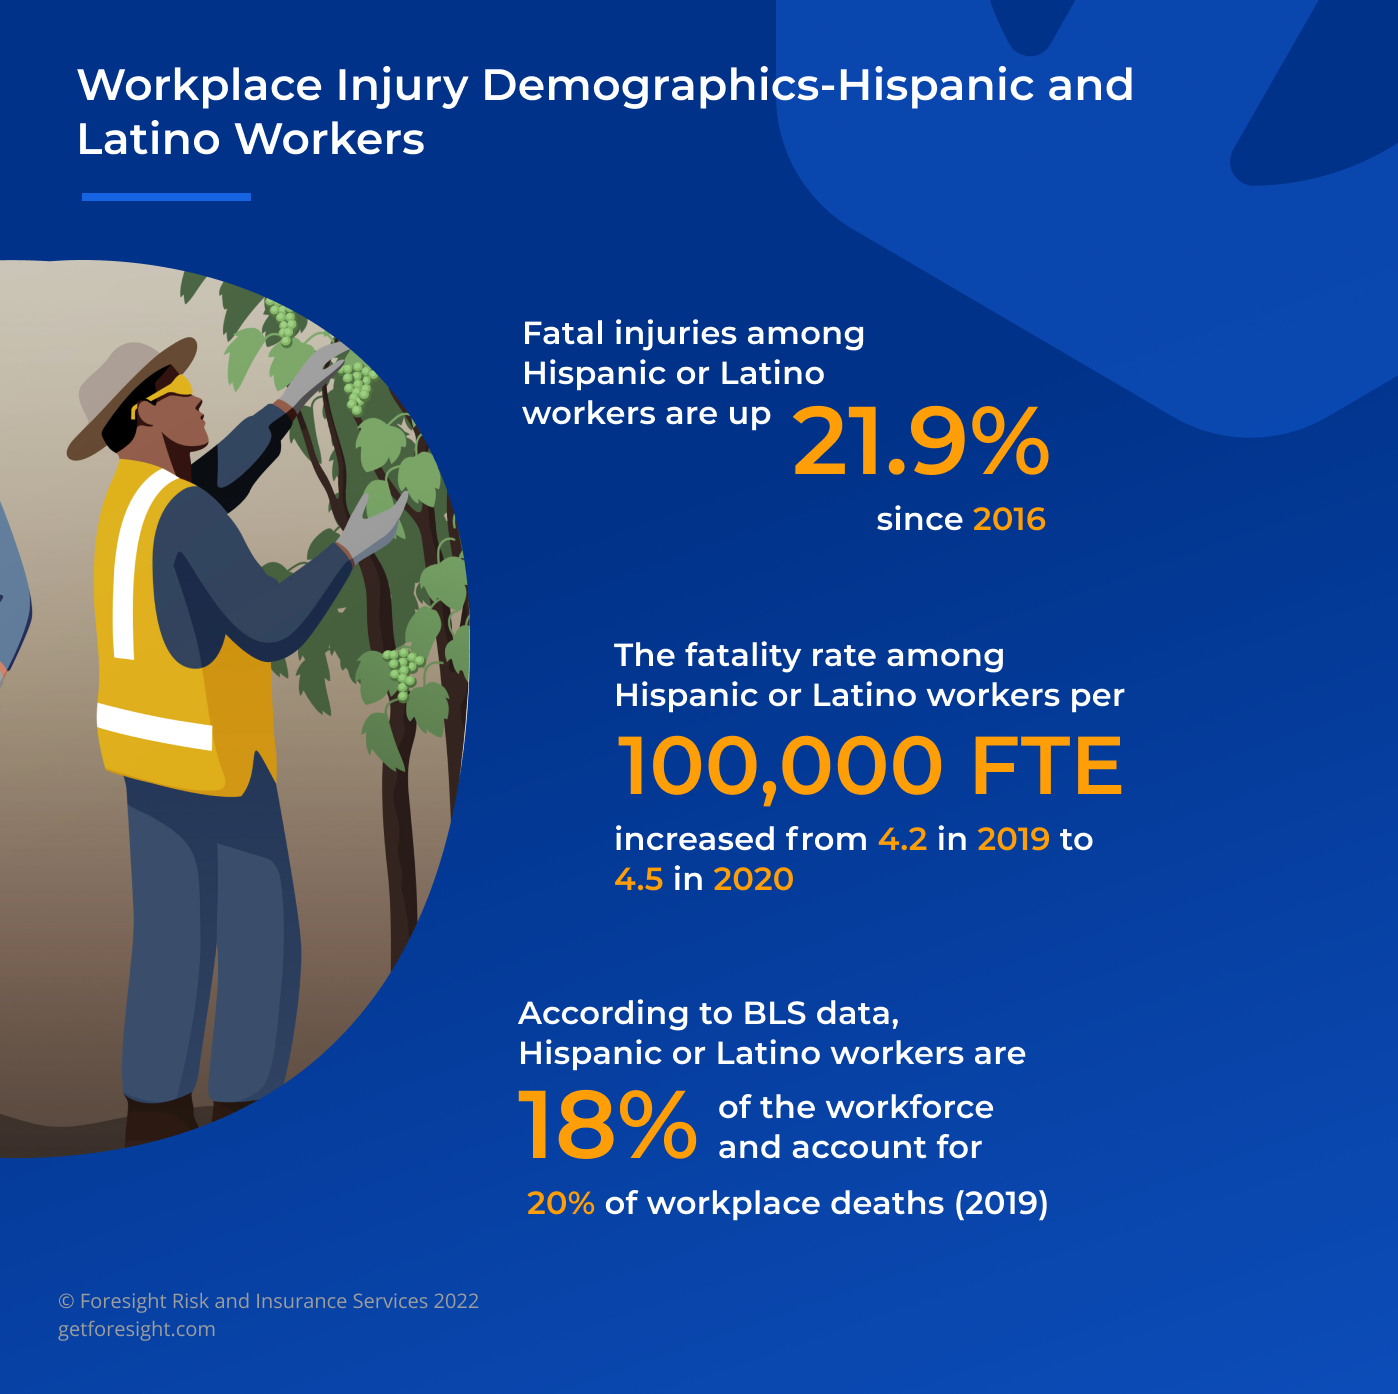
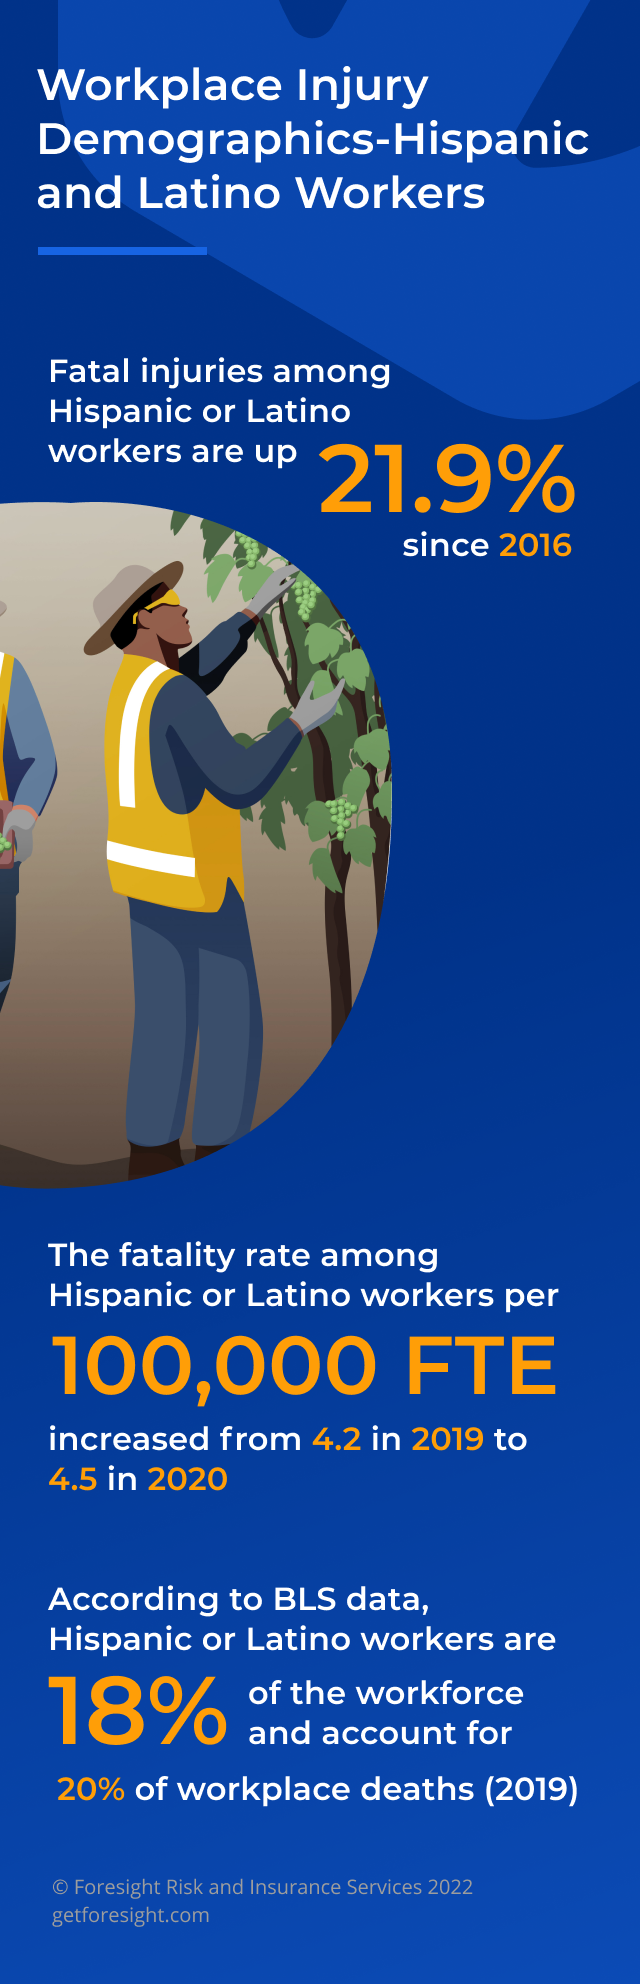
Fatalities are up 21.9% since 2016 and have increased to more than 1,000 per year over the last two years (2019-2020).
BLS data indicates that in 2019, Hispanic or Latino workers made up 17% of the US workforce. But, they accounted for 20% of workers who died on the job.
There is a critical need to address to reverse the trend that’s affecting this population of workers.
Workers Comp Claims Statistics
IIn the insurance industry, work-related injuries and illnesses translate into workers compensation claims. However, as brokers, we know not all claims are equal.
A claim for some stitches in a worker’s hand is not the same as a claim for amputation. Additionally, a slip and fall claim and a vehicle accident claim tend to play out very differently.
What claims are happening, and is there anything we can do to minimize the loss? Here’s what we found.

What Types of Workers Comp Claims are Most Expensive?
Medical claims and lost-time claims are two different animals. In terms of premiums, it’s lost time that could drive your clients’ premiums up (outside of California). Yet, it’s the medical claims that your clients have little-to-no control over. After all, they don’t control the costs of health care in the United States.
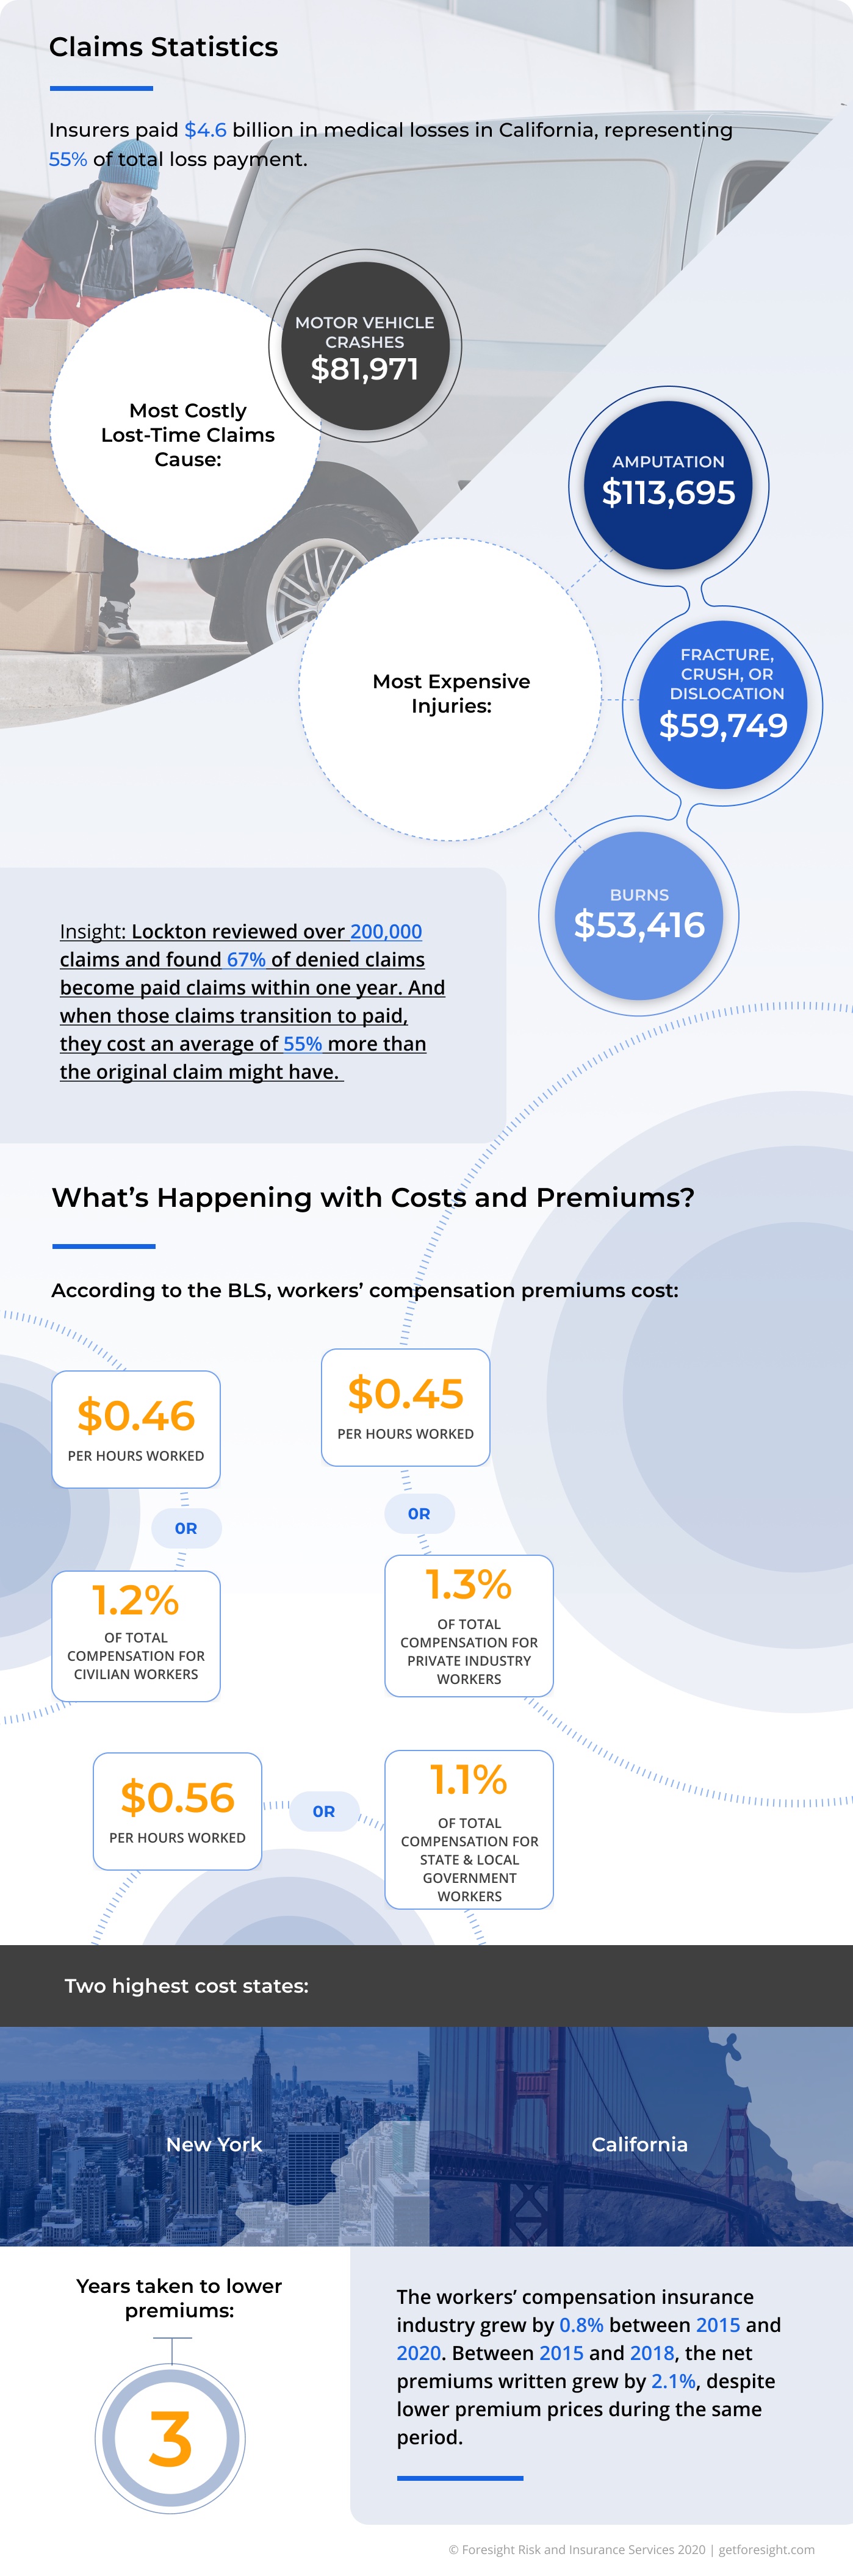
According to NCCI data provided by the National Safety Council, the most costly lost-time workers compensation claims by cause of injury come from motor-vehicle crashes. Motor-vehicle crashes remained the costliest claim in 2018-2019, costing an average of $81,971 per workers compensation claim ( up $3,678 from 2016-2017).
Why is this a problem? Beyond the sheer cost of these claims, the vast majority of workplace injuries are the product of motor vehicle crashes.
The only other causes with above-average costs were burns ($58,284), falls or slips ($47,681), and caught ($45,255).
So while the most expensive cause of injury claims come from motor vehicle The most expensive lost time injuries were amputations, costing $113,695 per workers compensation claim. Following this claim in costs were injuries from fracture, crush, or dislocation ($59,749), other trauma ($59,298), and burns ($53,416).
How Much Are Insurers Paying in Workers Compensation Claims?
The cost of claims changes wherever you go. However, California provides a good example of how much an insurer could pay out given the size of its market.
In California, the WCIRB 2020 California workers Compensation Losses and Expenses report found that
- Insurers paid $4.0 billion in medical losses
- Insurers paid $3.7 in indemnity benefits (53% for temporary disability and 36% for permanent partial disability)
- Total combined losses were $12 billion
In 2018, total losses were $13.3 billion or 77% of the calendar year premium. The results indicate that claims in both years were comparable, but premiums went down as a result of fewer injuries and less fraud.
Even still, California has the most prolonged payouts of any state. And that’s a big problem for both insurers and workers.
Data shows 56% of accident per-year medical payments get paid more than three years after the beginning of the year of injury. Why? It could be because of the cure or relieve standard or the number of cumulative trauma claims.
However, the national average of claims paid after three years is 33%. So, California still has some explaining to do.
California insurers aren’t just slower to write checks. The state takes 11 years to settle 95% of indemnity claims.
What’s the Secret to Controlling Workers Compensation Costs?
If there’s one thing employers, insurance providers, brokers, and agents all have in common is the desire to lower costs. Agreeing on that point is easy. Figuring out how to make it happen is a different issue entirely.
Positive Workers Compensation Claims Process
As mentioned earlier, employers have little cost over the cost of health care. Returning to work faster is where money can be saved. And research suggests there’s room to put more emphasis on return to work.
A national, cross-sectional survey of 10,946 workers found that the workers compensation claims management process plays a role in return to work. The study found that 23% of workers said the claims process was negative or neutral with longer claims processing contributing to a poorer experience.
Having a positive experience was associated with self-reported return to work. It suggests that speeding up claims and making them easier can help get employees back to work faster, which in turn lowers the costs of claims due to short periods of lost time.
Providing Nurse Case Management
In a study run by Zurich, researchers found that nurse case management and early nurse referral can result in average savings of $6k-$26k by ensuring workers get the best care and can return to work quickly. The results found that engaging nurses early could knock as much as 50% off the medical bill.
Reducing the Number of Denied-to-Paid Claims
Other surprising news: Lockton reviewed over 200,000 claims and found 67% of denied claims become paid claims within one year. And when those claims transition to paid, they cost an average of 55% more than the original claim might have. The report from Lockton found that when an insurer accepts a claim upon application, it pays an average of $10,153. A denied-to-approved converted claim costs $15,694.
Is conversion a big issue in your state? If you sell insurance in California, then you work in the state with the highest conversion rate. Texas agents and brokers work in a state with a lower conversion rate than the national average.
Workers Comp Costs and Premiums Statistics
In the United States, the workers compensation insurance industry grew by 0.8% between 2015 and 2020. Between 2015 and 2018, the net premiums written grew by 2.1% despite lower premium prices during the same period.
How much are employers spending? According to the BLS, workers compensation premiums cost:
- $0.46 per hour worked or 1.2% of total compensation for civilian workers
- $0.45 per hour worked or 1.2% of total compensation for private industry workers
- $0.58 per hour worked or 1.1% of total compensation for state and local government workers
Naturally, high-risk industries spend more on workers compensation premiums than others. The Center for Construction Research and Training says that workers compensation makes up far more of employers’ compensation costs in construction than other industries.
Where is workers compensation most expensive?
The two highest cost states in the U.S. are New York and California. This stat surprises no one in the industry given the size of the workforce and robustness of state workers comp laws.
However, in the state of California, the cost of workers comp premiums is falling. Lower premium costs are the product of falling claims severity and workers comp reforms, particularly the reforms aimed at reducing fraud.
The average cost per $100 fell, as the WCIB predicted, to $1.77 in 2020. It dipped even lower in the first quarter of 2021, to $1.74.
Written premium in 2020 dropped to an eight-year low, down 23% from a peak of $18.1 billion in 2016.
In fact, the WCIRB expects an overall drop in written premium from $15.9 billion in 2019 to $12.5 billion 2020. In other words, California alone will spend $3.5 billion less.
What’s happening in other workers comp markets?
Let’s head over to Texas, which is a vastly different workers comp market. Private sector employers have the option to opt-out or non-subscribe to workers comp coverage — and they have had the choice since 1913.
Research from the Division of Workers’ Compensation found that Texas employers subscribe to provide medical care for injuries and benefit from lower premium rates.
Between 2016 and 2018, the percentage of private sector employers paying workers comp premiums fell from 78% to 72%. However, subscription rates for both years were still at the highest levels since 1993.
Additionally, 67-72% of subscribers reported their premiums either fell or remained the same for the year 2018.
Will Workers Comp Rates Drop in the Future?
Premiums are down, but will they continue to fall? It’s hard to say, but the NCCI is making the argument for rate reductions in some industries.
The NCCI argued for a rate reduction in 2019 of 16.8% in the voluntary market, thanks to a reduction in accidents and injuries. Among individual industries, the NCCI argued for the following reductions:
- Manufacturing
- -17.5% voluntary market
- -20.4% assigned risk
- Contracting
- -17.6% voluntary market
- -20.6% assigned risk
- Office & clerical
- -17% voluntary market
- -20% assigned risk
- Goods & services
- -15.9% voluntary market
- -18.9% assigned risk
- Miscellaneous
- -17.1% voluntary market
- -20.1% assigned risk
Who’s Dominating the Workers Compensation Insurance Industry Right Now?
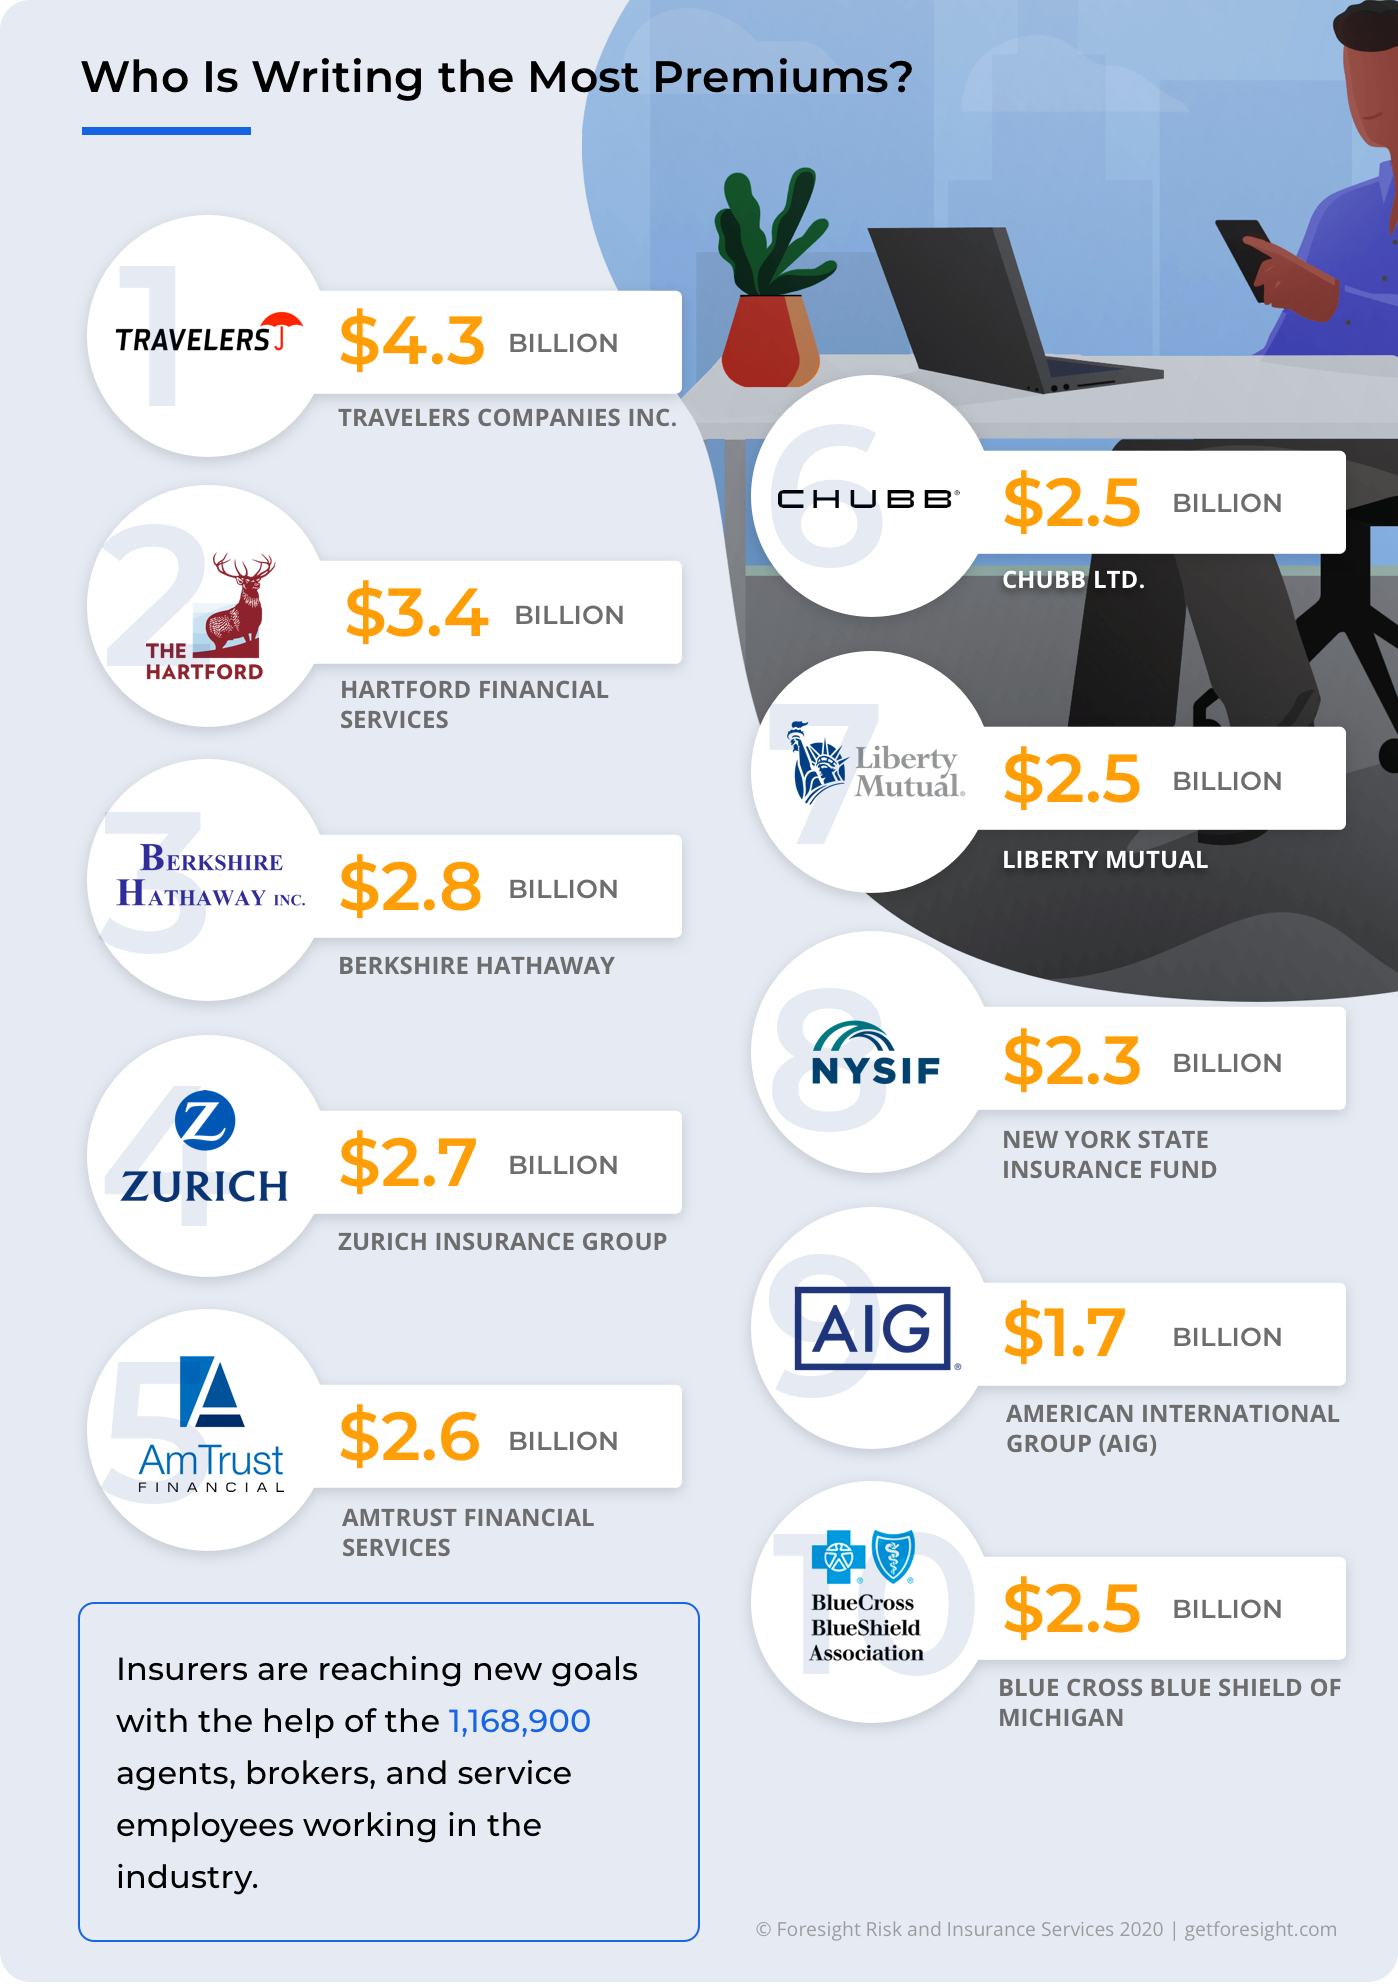
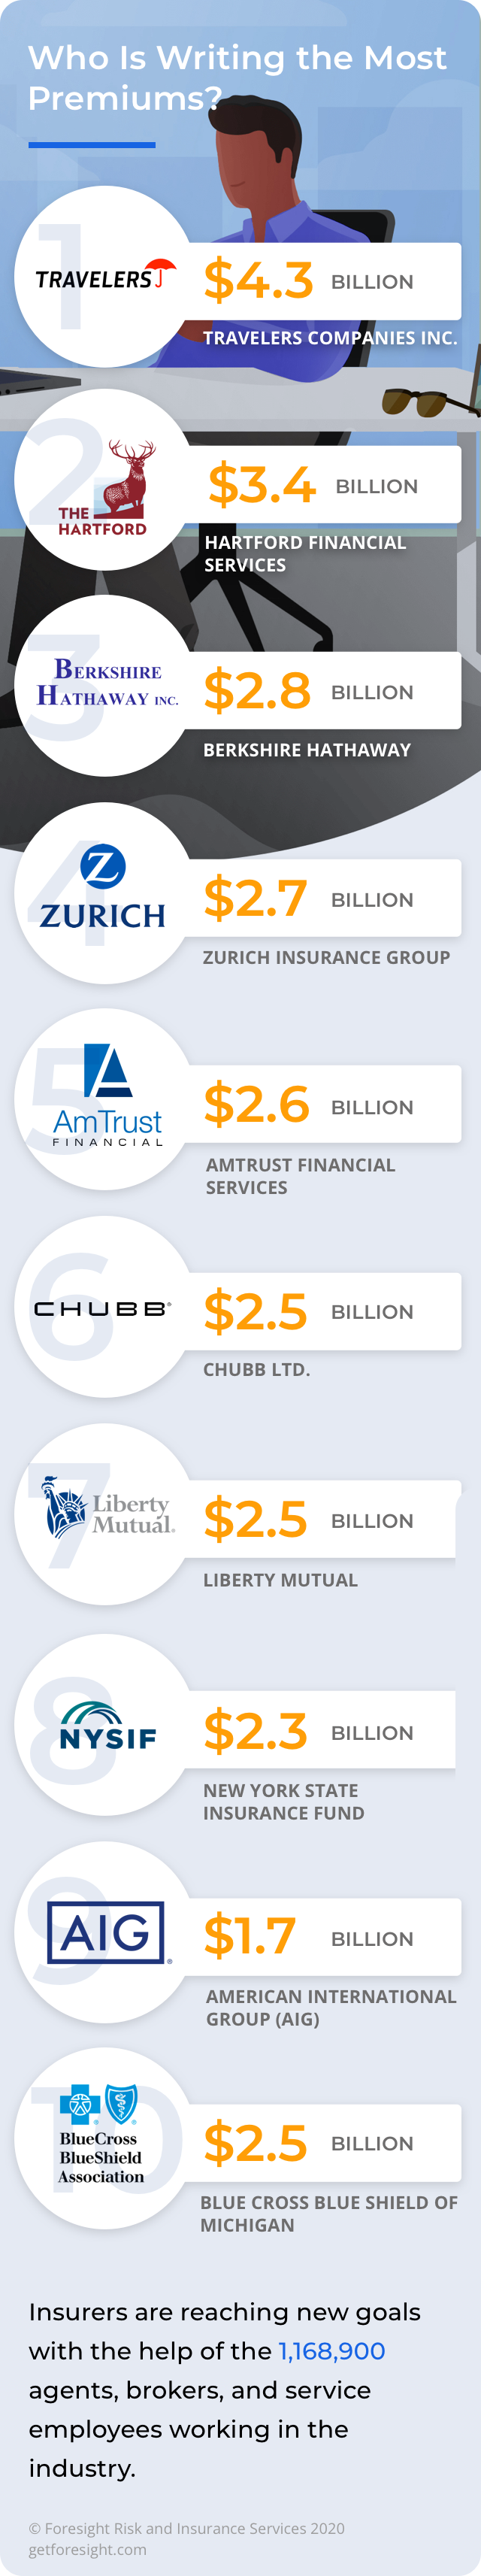
The The insurance industry continues to grow, with more than 2.86 million workers now making their careers as agents, brokers, or general service employees.
Who Is Writing the Most Premiums?
- Travelers Companies Inc. $3.7 billion
- Hartford Financial Services $2.9 billion
- Zurich Insurance Group $2.4 billion
- Chubb Ltd. $2.2 billion
- Liberty Mutual $2.1 billion
- Berkshire Hathaway $1.9 billion
- AmTrust Financial Services $1.9 billion
- Accident Fund Group $1.6 billion
- New York State Insurance Fund $1.6 billion
- Old Republic International Corp. $1.3 billion
What the 2021 Work Comp Stats Indicate
The total recordable incidence rate decreased by 3.6% in 2020, despite the COVID-19 pandemic. Part of this decrease can be contributed to fewer workers on the job. Layoffs, furloughs, and remote work decreased the number of workers on job sites.
There is more nuance to specific workplace situations than the stats tell us at face Fewer incidents appear to be leading to lower workers comp rates in states like California. While many statistics are trending in the right direction, industries that are unable to work remotely are still experiencing losses.
However, as fatalities and workplace injuries are decreasing, an opportunity has presented itself to continue this trend by making significant changes in workplace safety.
Making workplaces safer starts with:
- Addressing fatality and injury disparities with minority populations and implementing safety measures that reduce the number of incidents
- Implementing safety tech with workers comp programs so companies have fewer claims and lower premiums
- Creating training programs that engage workers early in their career and teach them best practices to avoid workplace injuries
- Changing workplace cultures to support employees who speak out about dangerous situations or tasks