Texas is famous for being the only state where private-sector employers can opt-out of workers compensation coverage.
Yet, as insurance professionals, you know that the workers compensation landscape in Texas is so much more complicated than that simplistic narrative. As always, workers compensation statistics tell a much more dynamic story.
Industry professionals and legislators get Texas workers compensation statistics every two years in the Division of Workers Compensation (DWC) Biennial Report.
Here’s what you need to know from the latest 2018 report, so you can prepare your business and your clients for what’s coming down the road in 2020.
- What You Need to Know About Fatal Occupational Injuries in 2020
- Texas Recordable Injury Rates up to 2020
- Subscribers vs. Non-Subscribers: Who Has Workers Compensation Coverage in Texas?
- Workers Compensation Claims Data for Texas
- Who is Writing Workers Compensation Policies in Texas?
- Workers Compensation Fraud Statistics 2020
What You Need to Know About Fatal Occupational Injuries in 2020
Fatal occupational injuries may be much lower now than they were decades ago, but even one death at work is too many. Where are we today?
The latest available national data from the Bureau of Labor Statistics and OSHA dates to 2018 — the 2019 data will likely become at the end of 2020. The same is true from reports from the Texas Department of Insurance, which tabulates Texas workplace injury data.
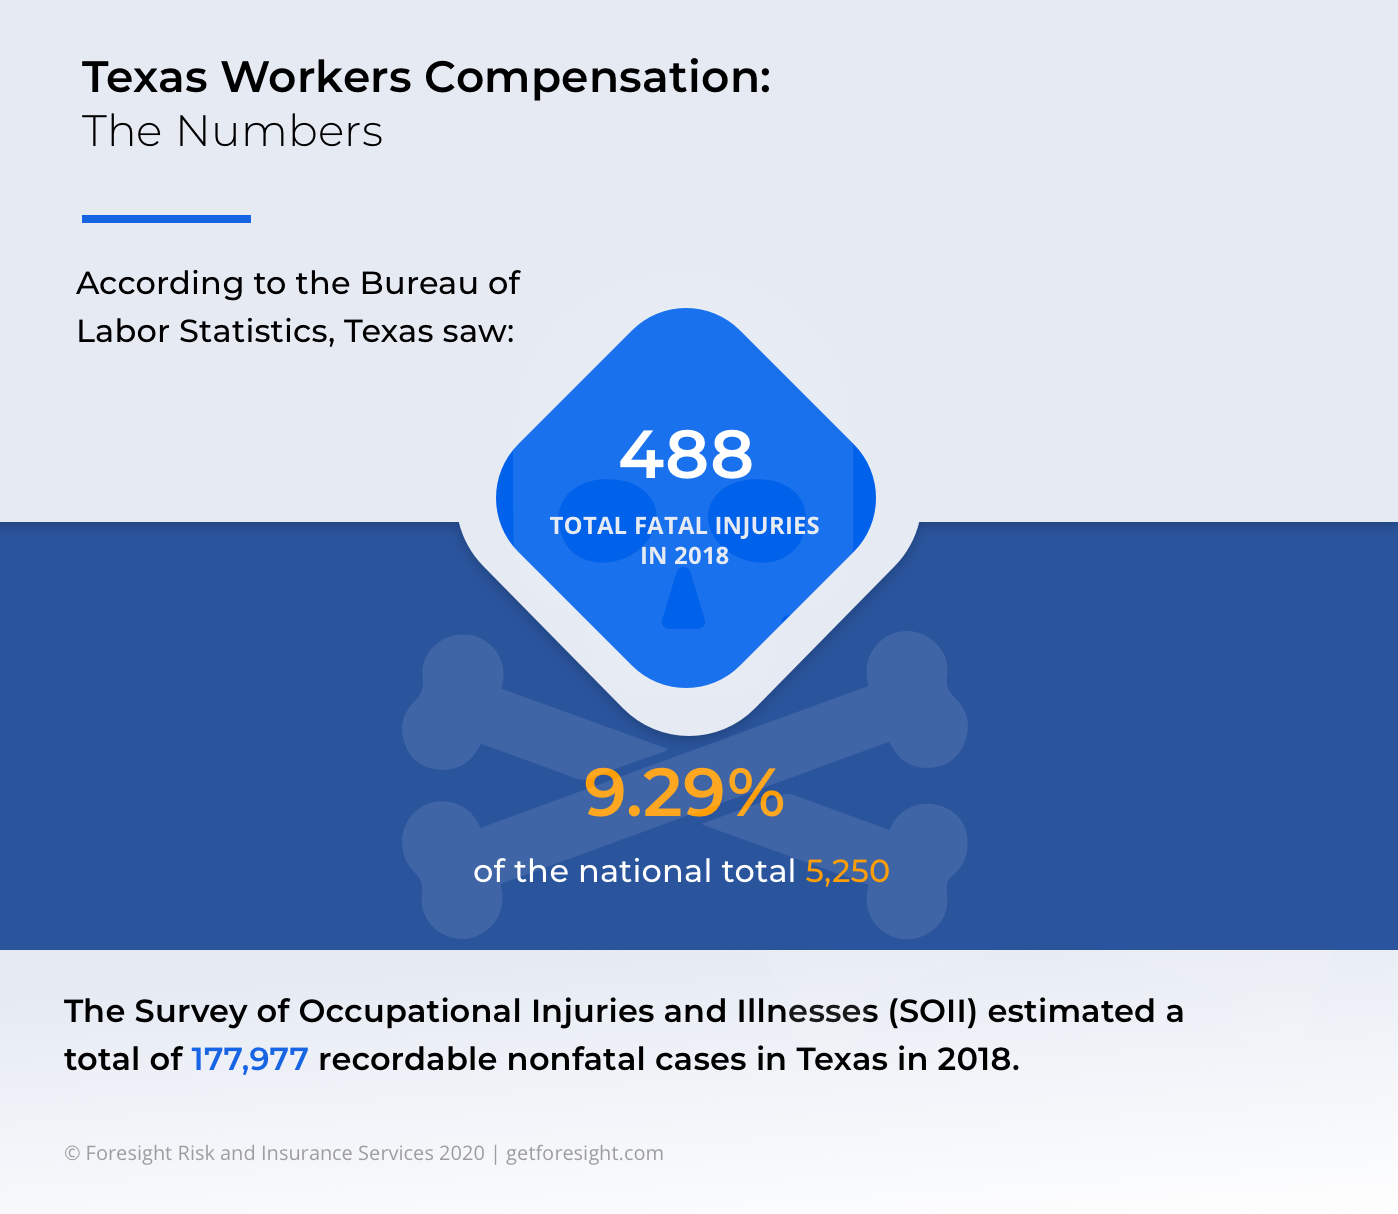
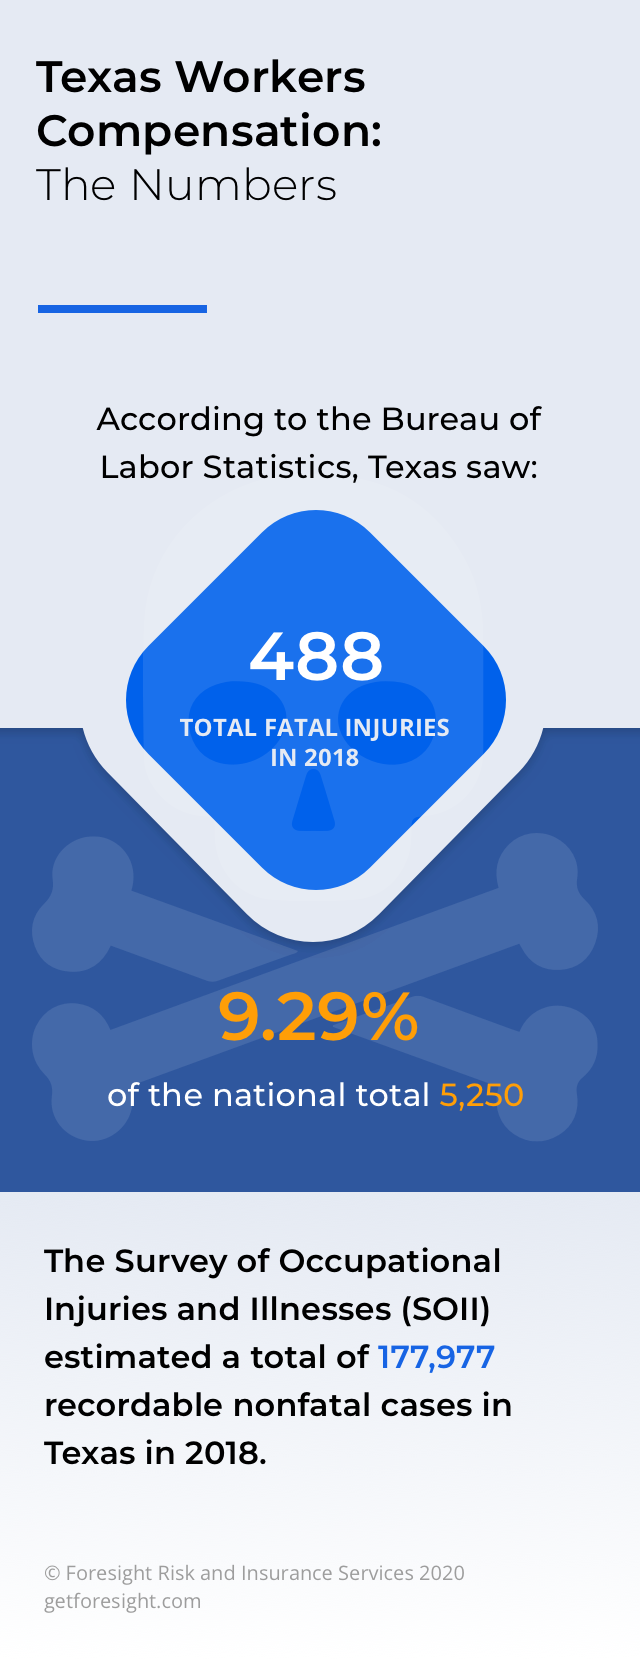
Texas saw 488 total fatal occupational injuries in 2018. Across the country, a total of 5,250 U.S. workers died in 2018 after suffering fatal occupational injuries. That means Texas made up 9.29% of total fatalities.
Unfortunately, this isn’t a new problem in Texas. In 2016 and 2017, one worker in Texas died on the job every 16 hours.
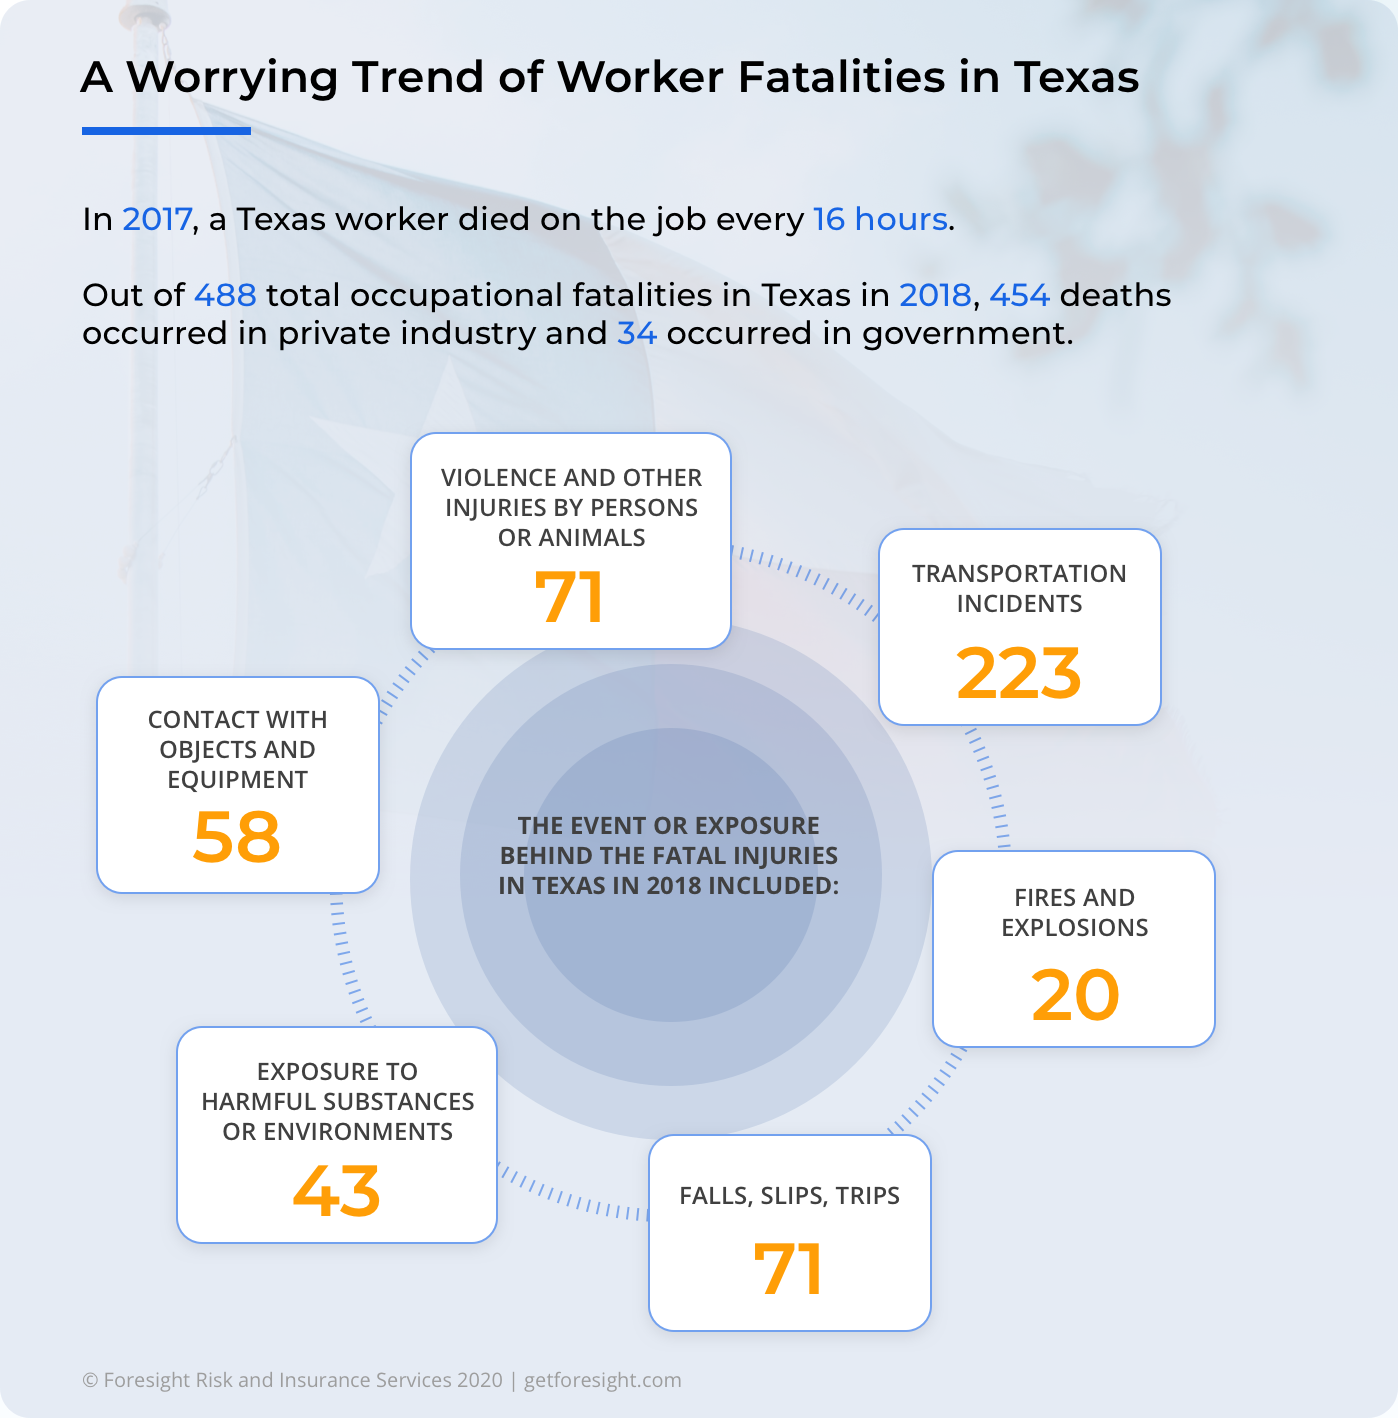
What are the accidents behind these tragedies? The event or exposure behind the fatal injuries in Texas in 2018 included:
- Violence and other injuries by persons or animals: 71
- Transportation incidents: 223
- Fires and explosions: 20
- Falls, slips, trips: 71
- Exposure to harmful substances or environments: 43
- Contact with objects and equipment: 58
Among employees, the vast majority of the total fatal injuries occurred among waged and salaried employees (402). Only 86 fatalities occurred among self-employed workers.
Other demographics provide a clearer picture of who is dying at work in Texas:
- 455 of the 488 total occupational fatalities were men
- only 33 occupational fatalities were women
Additionally, there was a relatively equal split between 25 and 64 years. Fatalities among age groups in 2018 were as follows:
- Under 16 years – 0
- 16-17 years – 0
- 18-19 years – 5
- 20-24 years – 32
- 25-34 years – 99
- 35-44 years – 98
- 45-54 years – 115
- 55-64 years – 89
- 65 years and over – 50
The race and ethnic origin breakdown included:
- 219 White (non-Hispanic)
- 56 Black or African American (non-Hispanic)
- 198 Hispanic or Latino
- 0 American Indian or Alaska Native (non-Hispanic)
- 12 Asian (non-Hispanic)

What Are Texas’s Most Dangerous Industries in 2020?
As insurance professionals, we think in terms of risk. In many cases, risk in workers compensation comes down to the danger we perceive in a particular industry.
Some industries, like construction, come with a much higher risk than others, like finance and real estate. It shows: construction comes with more injuries and fatalities than many other industries.
Out of 488 total occupational fatalities in Texas in 2018, 454 deaths occurred in private industry, and 34 occurred in government.
The private industry occupational death breakdown by industry includes:
- Goods Producing – 198
- Natural resources and, mining 73
- Construction – 107
- Manufacturing 18
- Service providing – 256
- Trade, transportation, and utilities 164
- Financial activities – 4
- Professional and business services – 44
- Professional, scientific, and technical services 13
- Administrative and waste services 31
- Education and health services – 12
- Educational services – 4
- Health care and social assistance – 8
- Leisure and hospitality – 15
- Accommodation and food services 13
- Other services – 16
The government occupational death statistics include 5 federal, 5 state, and 23 local government deaths.
At the local government level, there were 8 deaths by violence, 7 transportation incidents, and 3 slips, trips, and falls.
Texas Recordable Injury Rates up to 2020
Like most of the U.S., Texas has seen a reduction in non-fatal occupational injury and illness rates over 20 years, but the numbers over the last few years tend to hold steady.
There were 2.8 million nonfatal workplace injuries and illnesses recorded across the U.S. in 2018. The Survey of Occupational Injuries and Illnesses (SOII) estimated a total of 177,977 recordable nonfatal cases in Texas in 2018.
The question is: what industries and workplaces are most vulnerable to injuries? The answer is surprising. Texas had a lower private industry incidence rate than the national private industry rate in 2018.
Data shows that agriculture, forestry, fishing, and hunting comes with the highest incident rate of 5.7. At the same time, arts, entertainment, and recreation come in second with a number that’s too close for comfort (4.8).
The total recordable cases for 2018 by industry are:
- All industries including state and local government – 1.9
- Private Industry – 2.0
- Goods-producing – 1.9
- Natural resources and mining- 1.6
- Agriculture, forestry, fishing, and hunting – 5.7
- Crop production – 4.4
- Animal production and aquaculture – 6.9
- Fishing, hunting, and trapping – —
- Support activities – 6.4
- Mining, quarrying, and oil and gas extraction – 0.9
- Mining except for oil and gas – 1.5
- Support activities – 0.9
- Construction – 1.6
- Construction of buildings – 1.1
- Heavy and civil engineering construction – 1.7
- Specialty trade contractors – 1.8
- Manufacturing – 2.3
- Food manufacturing – 3.2
- Beverage and tobacco manufacturing – 3.3
- Leather and allied product manufacturing – 0.9
- Wood product manufacturing – 4.8
- Paper Manufacturing – 3.7
- Printing and related support activities – 1.0
- Chemical Manufacturing – 1.0
- Plastics and rubber products – 3.4
- Nonmetallic mineral products – 2.6
- Primary metal – 3.8
- Fabricated metal -3.1
- Machinery – 1.7
- Computer and electronics – 0.6
- Electrical equipment, appliance, and components – 1.7
- Transportation equipment – 2.2
- Furniture and related products – 2.7
- Miscellaneous – 1.6
- Service providing – 2.1
- Trade, transportation, and utilities – 3.0
- Wholesale trade – 2.1
- Retail trade – 3.2
- Transportation and warehousing – 3.7
- Utilities – 1.5
- Information 1.1
- Motion picture and sound recording – 3.2
- Broadcasting 0.3
- Telecommunications – 1.3
- Finance insurance, and real estate 0.6
- Professional and business services – 1.0
- Healthcare and social assistance – 3.6
Returning to Work in Texas
Getting employees back to work faster lowers the cost of workers compensation claims and ultimately contributes to lower premiums. Injured employees who return to work within six months have fewest days away from work.
While employers can’t prevent every single injury, illness, and claim, they can create programs that get employees the care they need and the support required to get back to work.
In 2007, 78% of injured employees returned to work within six months. By 2017, the number grew by five points to 83% returning to work within the first six months post-injury.
Those who are back to work within six months return to their pre-injury wage level around two years after their return.
Additionally, nine out of ten employees are back on the job in some capacity within a year. And 95% come back within three years.
Where are Texas’ weaknesses?
Older injured employees have more days away from work: workers aged 60+ have ten more days away from work than injured 16-29-year-olds.
What industries are seeing the most number of days away? Employees in the mining, utilities, construction, and agriculture have the highest average and a median number of days away.
Subscribers vs. Non-Subscribers: Who Has Workers Compensation Coverage in Texas?
Texas is the only state in the U.S. that allows all private industry employers to opt-out of workers compensation coverage. Those who opt out are non-subscribers.
Measuring the subscriber and non-subscriber rate provides us with a lot of insight into the workers compensation landscape. Unlike in other states, it generates two fully legal pools of employer data to work with. Researchers at the DWC use it to determine the appropriate policy to shape workers compensation and liability law. They also use it to help inform systems for care, as you’ll see below.
So, who has workers compensation coverage in Texas? It’s more people than the state often gets credit for.
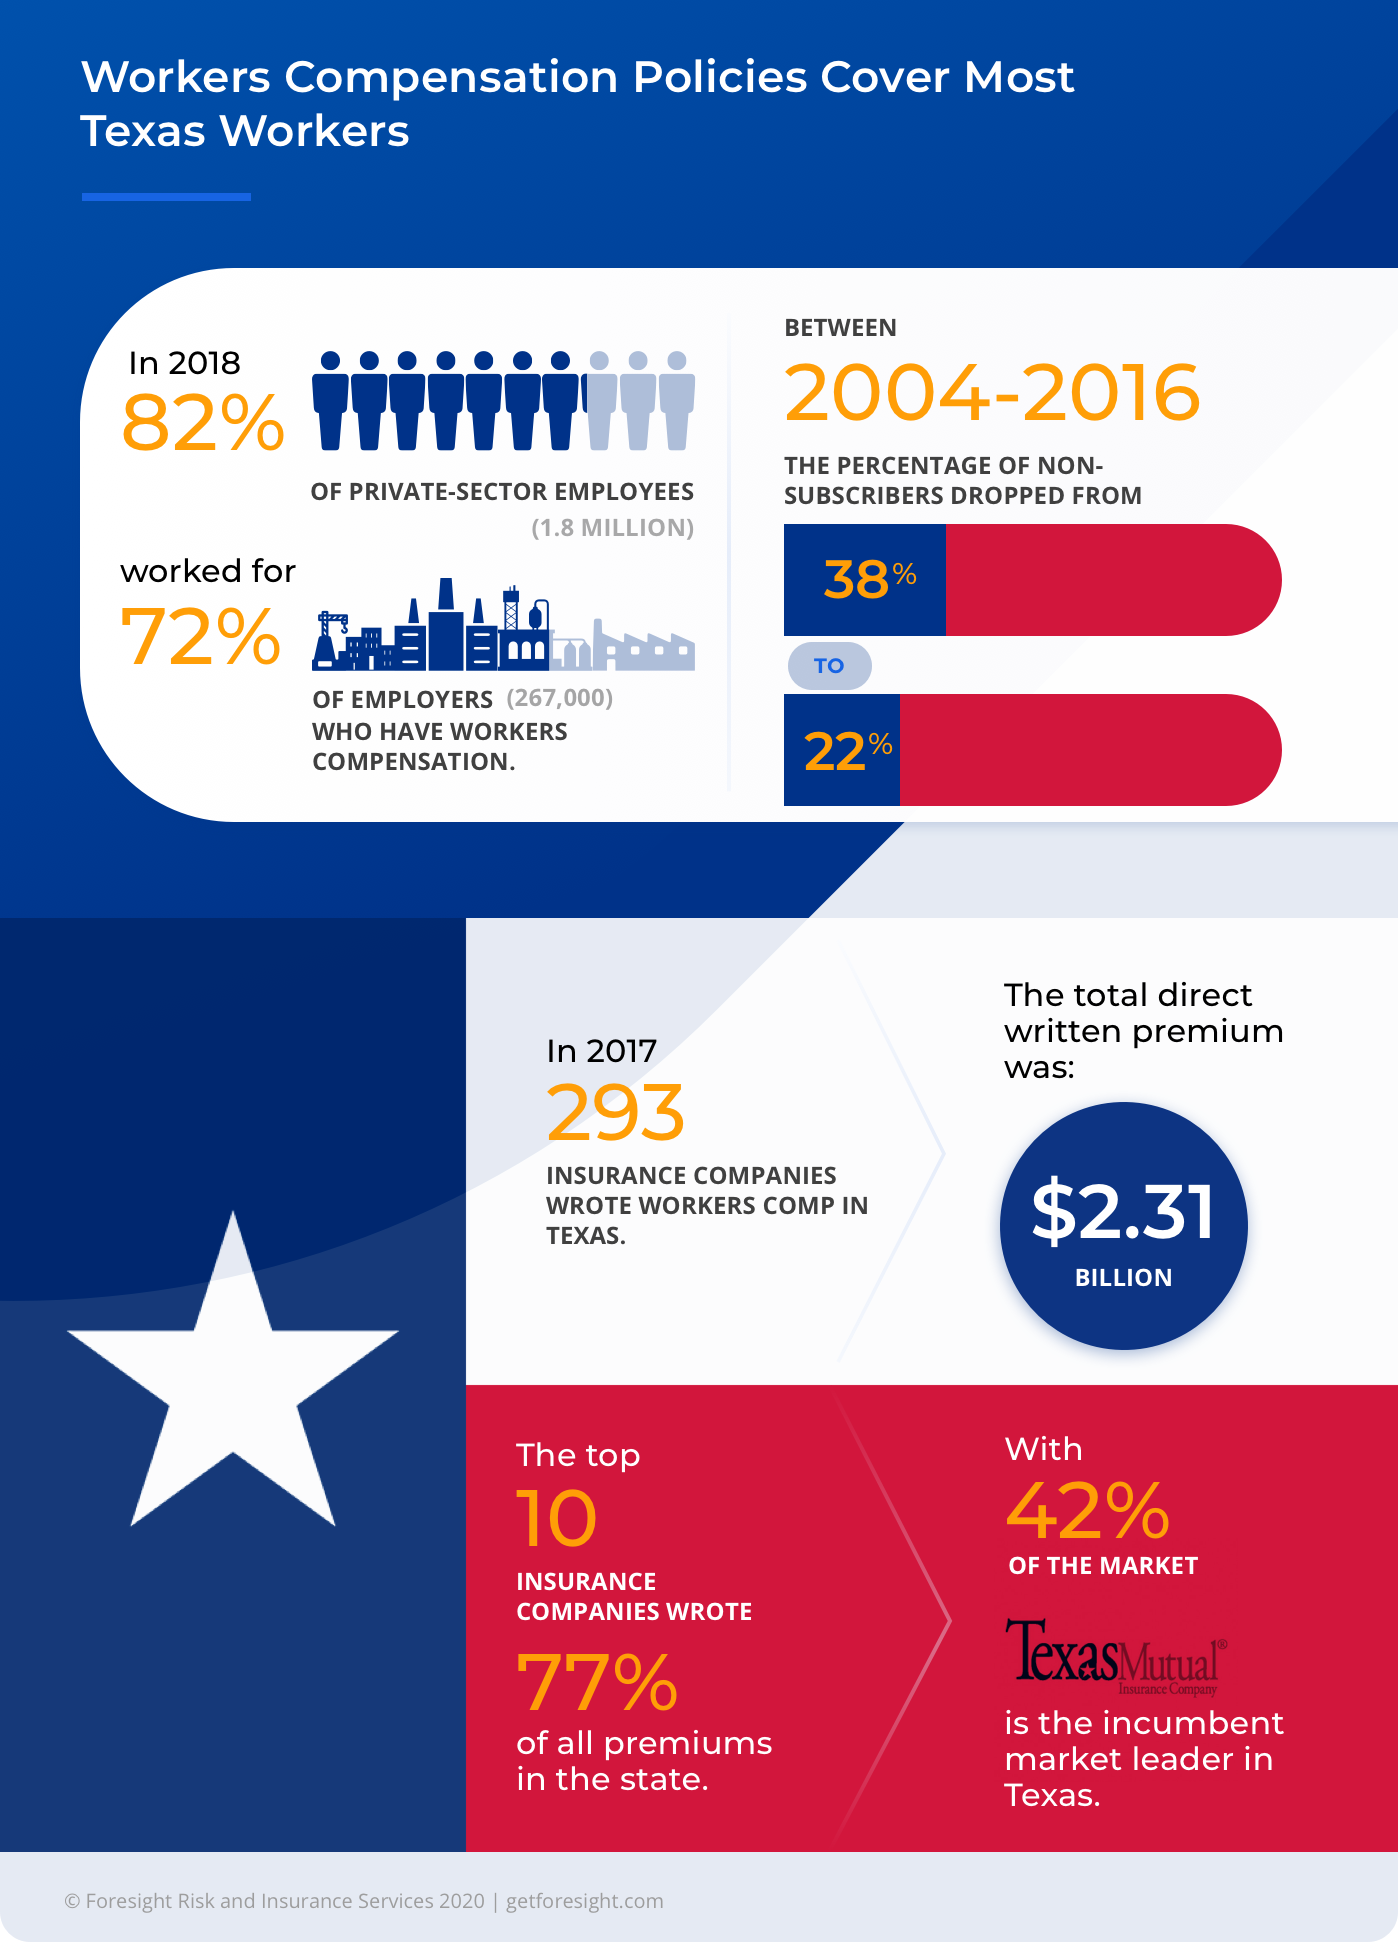
In 2018, 82% of private-sector employees (1.8 million) worked for 72% of employers (267,000) who have workers compensation.
Only 28% of private, year-round employers don’t have workers comp, and they employ just 17% of the private industry workforce.
In other words, smaller employers are more likely to be non-subscribers, but they don’t account for as many employees. And it’s the coverage that counts rather than the number of subscribers.

Has Workers Compensation Subscription Fluctuated Over Time?
Between 2004-2016, the percentage of non-subscribers dropped from 38% to 22%. During this time, premium rates also dropped by 20%, making workers more affordable and thus enticing more employers to sign on.
Percentage of Texas Employers Non-Subscribers Over Time:
- 44% of employers non-subscribers in 1993
- 28% of employers non-subscribers in 2018
- 22% of employers non-subscribers in 2016
The number of employees left uncovered by working for non-subscribers hasn’t changed much. It reached a peak of 25% in 2008, and a low of 16% in 2001.
The data for the last ten years shows the figures hovering around the same mark:
- 2010: 17%
- 2012: 19%
- 2014: 20%
- 2016: 17%
- 2018: 17%
Non-Subscribers Aren’t Off the Hook
A common misconception suggests that non-subscribers don’t provide useful data for understanding the state of workers compensation insurance.
But by no means are non-subscribers untrackable. Non-subscribers must file a notice annually stating they don’t have workers comp coverage (DWC Form-005). Non-subscribers with five or more employees must also file DWC Form 007 for each disease and on-the-job injury with more than one day of lost time. Failure to report comes with penalties.
For now, the issue is that the DWC relies on reporting from the community to generate data. And communityreports are few and far between. Internal monitoring only goes so far.
In the 2018 report to the Texas Legislature, DWC reported internal monitoring efforts generated most of 2,853 complaints reported since 2009. Those complaints generated 464 warning letters and nearly $93,000 in penalties for failure to file forms or failure to respond.
Very often, non-subscribers submit data that is incomplete, late, or inaccurate — or all three.
Only 19% of non-subscribers complied with filing in 2018, whereas 35% complied in 2016. In 2014, 12% complied. As a result, it’s hard to get meaningful injury data beyond OSHA recordable and reportable injuries and the data generated by the BLS.
Additionally, non-subscribers tend to only report injuries they accept liability for. The DWC suggests this may explain why injury reports from non-subscribers are fewer in number than those reported by subscribers.
Workers Compensation Claims Data for Texas
After having a look at Texas injuries, let’s see how safety on Texas job sites compares with claims and premiums.
Data from the NASI found that cash benefits paid to workers in Texas were as follows (in thousands):
- 2012: $637,493
- 2013: $599,513
- 2014: $595,1113
- 2015: $640,520
- 2016: $628,436
NCCI data found that the average for all worker’s compensation claims across the country was $40,051 in 2016-2017. The most expensive claims by cause include:
- Motor vehicle crashes – $78,293
- Burns – $47,878
- Falls or slips – $46,592
- Caught – $40,791


Regulation Changed the Texas Workers Comp Landscape
In 2001, Texas was among the most expensive states in terms of cost per claim. Texas’s medical cost per claim is 21% less than the median cost of 18 states, including Florida, Illinois, Louisiana, and Pennsylvania. Though Texas claims are still more expensive than California, Michigan, and Massachusetts.
From 2013 to 2017, medical payments fell by 17%. Pharmacy payments decreased by 39%. Why did this happen?
Texas costs have stabilized as a result of legislation that streamlined the process for seeking medical attention.
In 2005, the Texas Legislature made changes to deal with poor injury outcomes and high costs. They adopted evidence-based treatment guidelines, certified workers compensation healthcare networks, and created a pharmacy closed formulary.
As of 2018, 29 certified health networks were covering 254 counties. The claims dealt with in-network grew from 20% in 2010 to 50% in 2018. Initially, costs were higher in-network, but in 2014 costs began to be lower in-network.
Texas also saw a net increase in the number of physicians treating injured employees since 2005. There were 17,656 physicians in 2005 to 18,419 in 2017.
Lower claims with a stabilized pool of physicians see a lower caseload per physician, which benefits everyone. In 2005, one physician handled a caseload of 19 claims. By 2017, there were under 15 claims per physician in 2017. It represented a 24% decrease.
Switching to In-Network Care Solved Disputes
As we mentioned in our national statistics post, workers compensation claim disputes are bad for everyone involved. Disputed claims transferred from the rejected pile to the accepted pile cost far more than claims accepted straight away.
A study by Lockton found that 67% of denied claims become paid within one year. Once accepted as paid, they cost an average of 55% more than the original amount.
In the past, Texas had a huge number of disputes. There were 13,000 medical disputes in 2005 before the legislative changes restructured care. By 2017, the number fell to 5,000, a reduction of 63%.
What’s more, it also takes much less time to resolve disputes that do occur. Between 2005 and 2017, the time frame dropped by 70-84%. The variation occurs depending on the dispute type.
Who is Writing Workers Compensation Policies in Texas?
In 2017, 293 insurance companies wrote workers comp in Texas, the total direct written premium was $2.31 billion. The top 10 insurance companies wrote 77% of all policies in Texas. Texas Mutual Insurance is the 5,000-pound gorilla of workers compensation in Texas. The insurer has 42% of the market and is the insurer of last resort.
Was there profit to be had? The projected accident year combined ratio was 92.3% in 2017. For every dollar an insurer collects in Texas, it pays 92.3% to cover losses and expenses.
How Much Do Workers Comp Premiums Cost Texas Employers?
According to the Biennial Report published in 2018, Texas workers compensation insurance rates dropped nearly 65% between 2003 and 2018.
How much are subscribers spending?
According to NASI data, Texas subscribers spent $0.39 per $100 of covered payroll on premiums in 2012 and then $0.29 in 2016.
Texas subscribers spent far below the total of $0.99 per $100 of covered payroll in 2012 and $0.83 in 2016 nationally.
Workers Compensation Fraud Statistics 2020
The Coalition Against Insurance Fraud estimates more than $80 billion worth of fraud claims are made annually across all insurance lines nationally.
Like every other state, Texas wants to prevent the waste and distrust that fraud creates. So, B=back in 2016, the DWC created a dedicated Fraud Unit to better tackle workers compensation fraud.
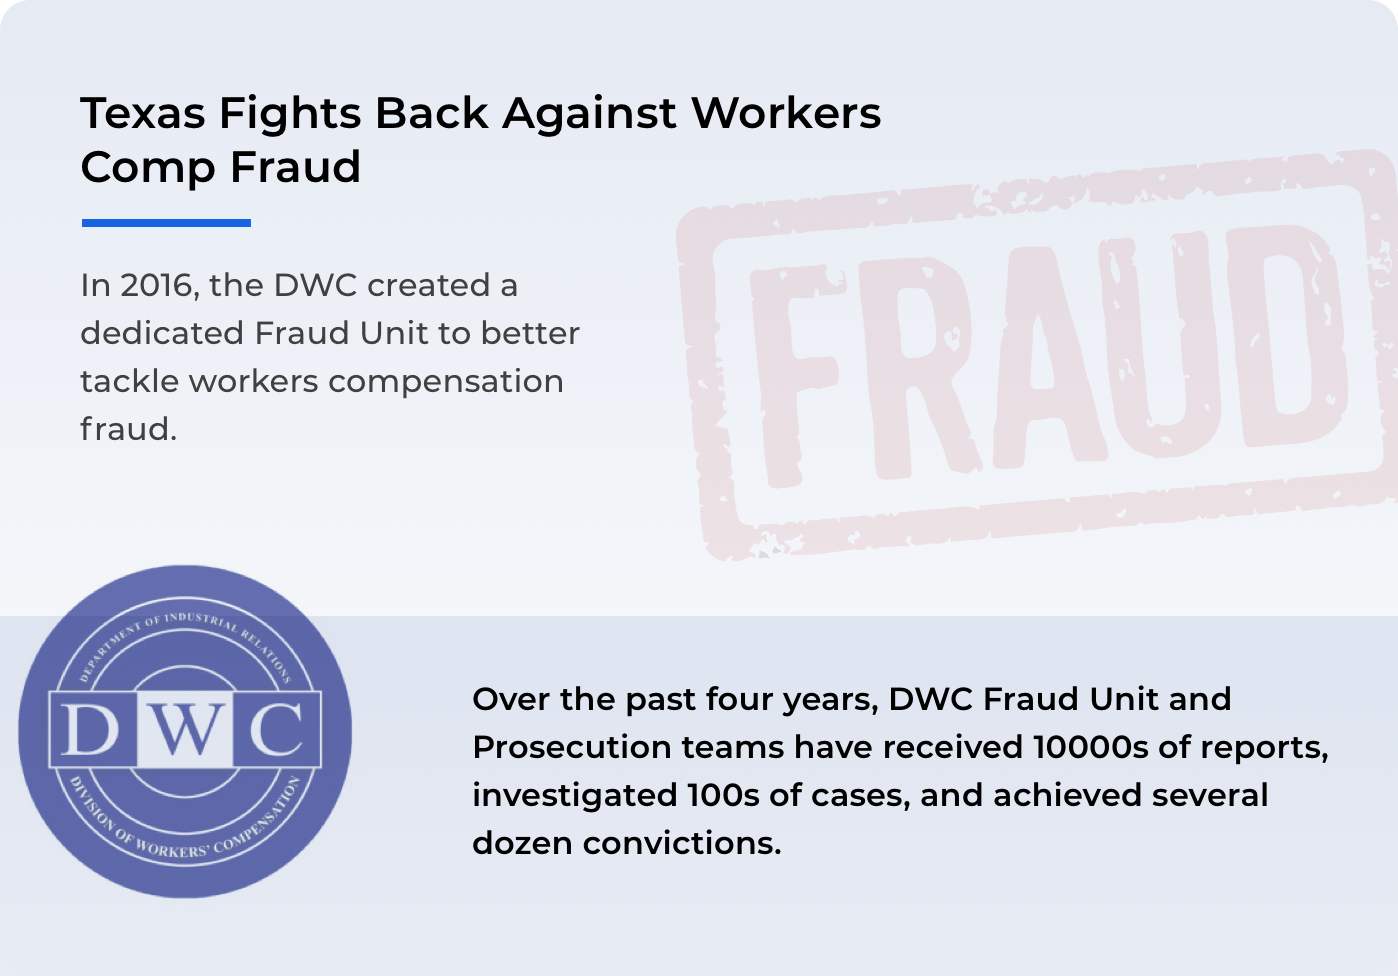
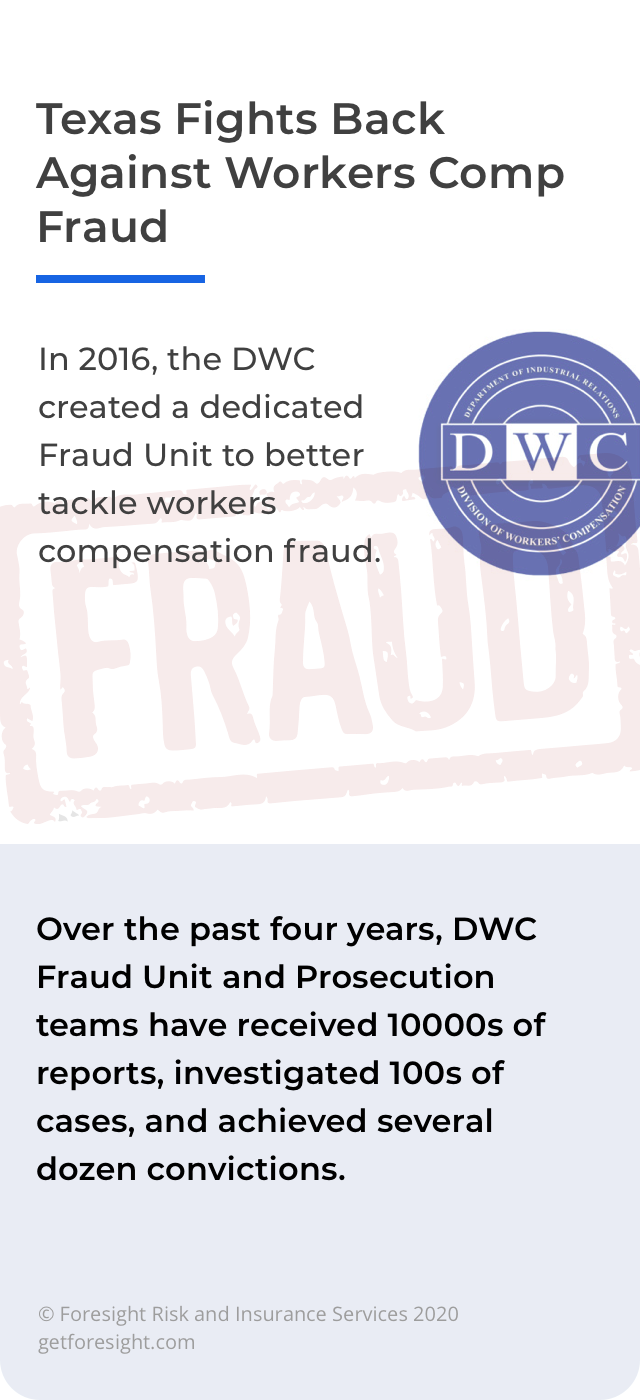
Since 2016 DWC Fraud Unit and Prosecution teams have received thousands of reports, investigated hundreds of cases, and achieved several dozen convictions.
The workers compensation fraud data for 2014-2019 is as follows:
| Activity | 2014 | 2015 | 2016 | 2017 | 2018 | 2019 |
|---|---|---|---|---|---|---|
| Reports Received | 1,853 | 2,186 | 1,624 | 1,600 | 1525 | 2,078 |
| Cases Opened for Investigation | 81 | 43 | 29 | 180 | 170 | 156 |
| Cases Referred for Prosecution | 11 | 6 | 11 | 16 | 29 | 9 |
| Convictions | 4 | 9 | 1 | 1 | 14 | 8 |
Do you have a keen interest in the subject? You can typically find coverage of convicted workers compensation insurance fraud cases in local and state press and The Insurance Journal.
Texas is One of the Most Important Workers Comp Markets in the U.S.
Texas has a reputation for allowing employers to do what they feel is right. Yet, most employers covering most Texas employees subscribe to workers compensation insurance — even though they aren’t legally compelled to do so.
Thanks to changes in legislation, workers compensation coverage offers more value to employers. It’s a streamlined way to get injured and sick employees the care they need and get them back to work sooner, not to mention a straightforward way to limit liability.
As insurance professionals, you need to earn every cent of your client’s premium in service. Foresight can help you do just that.


